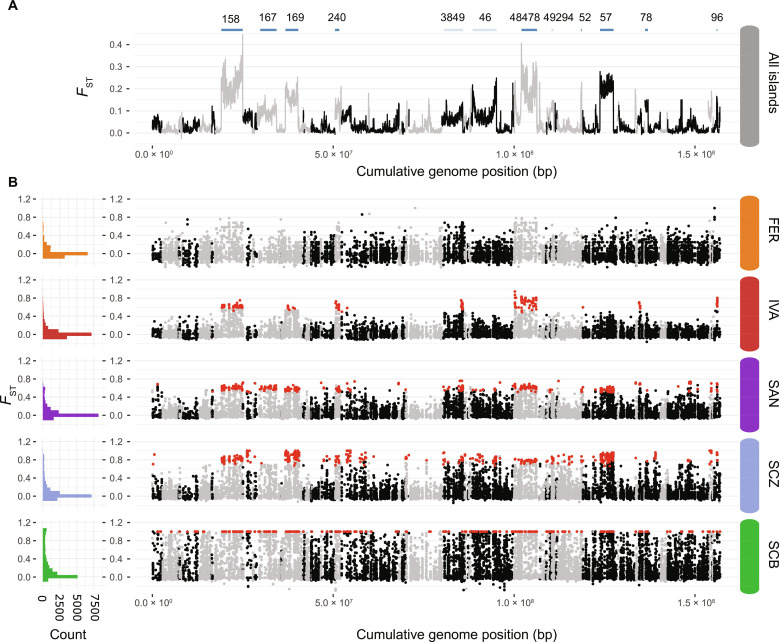
Fig. 4. Genetic differentiation between the high- and lowland species or populations.
(A) Genetic differentiation (FST) between all resequenced high- versus lowland individuals (20-kb windows). Upper blue line segments show the location of genomic regions tested for the presence of SVs, with those in dark blue being regions showing support for SVs based on anomalies in the orientation and insert size of read mappings as detected by BreakDancer (78). Scaffold IDs are given above each SV. bp, base pair. (B) Differentiation (FST) between high- and lowland individuals within each island at individual SNPs obtained from RADtag sequencing. Left histograms show the FST frequency distribution across the entire genome, and right panels show their location at the different genomic scaffolds. SNPs indicated in red are outlier SNPs with a significantly higher differentiation than expected by chance within each island comparison [BayeScan (35); Q value <0.1]. Color codes are as in Fig. 2.

