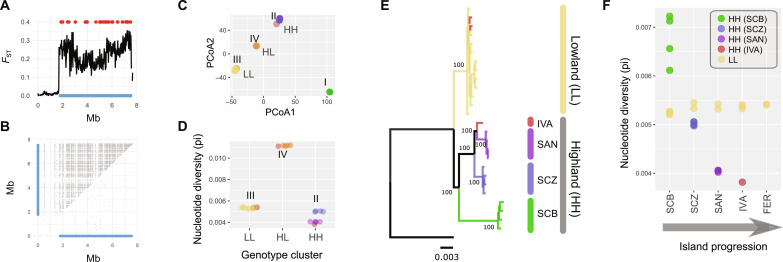
Fig. 5. SVs underlie distinct alleles associated with high-lowland divergence.
Results of a single scaffold (scaffold158) are shown. Results for the other scaffolds with SVs associated with high-lowland divergence are shown in fig. S4. (A) FST distribution (20-kb windows) based on a comparison between all resequenced high- versus lowland individuals. Blue bottom line shows the location of the chromosomal rearrangements detected by BreakDancer (78). Red dots show the location of RADtags identified as outlier loci in at least two within-island highland-lowland comparison. (B) Location of SNPs in perfect linkage disequilibrium (r2 = 1). Gray dots above the diagonal show r2 = 1 values for all 32 resequenced individuals. Gray dots below the diagonal show r2 = 1 values for homozygous lowland individuals only. (C) PCoA based on SNPs located at the inversion [blue line in (A)]. HH (cluster II), LL (cluster III), and HL (cluster IV) refer to the cluster of individuals genotyped at the inversion as homozygous for the highland allele (HH) and lowland allele (LL) and heterozygous (HL), respectively. Highland alleles of San Cristobal are denoted as cluster I. (D) Differences in nucleotide diversity at the inversion between individuals genotyped as HH, HL, and LL in (C). (E) ML tree of the nucleotide sequence at the inversion. Individuals genotyped as heterozygotes (HL) were excluded from the analysis. Node values represent bootstrap values based on 1000 replicates. The tree was rooted with the mainland species C. sayi. (F) Relationship between individual nucleotide diversity at the inversion and the progression of the islands. Only individuals genotyped as homozygous for the lowland allele (yellow) and highland allele (remaining colors) are included. Color codes are as in Fig. 2.

