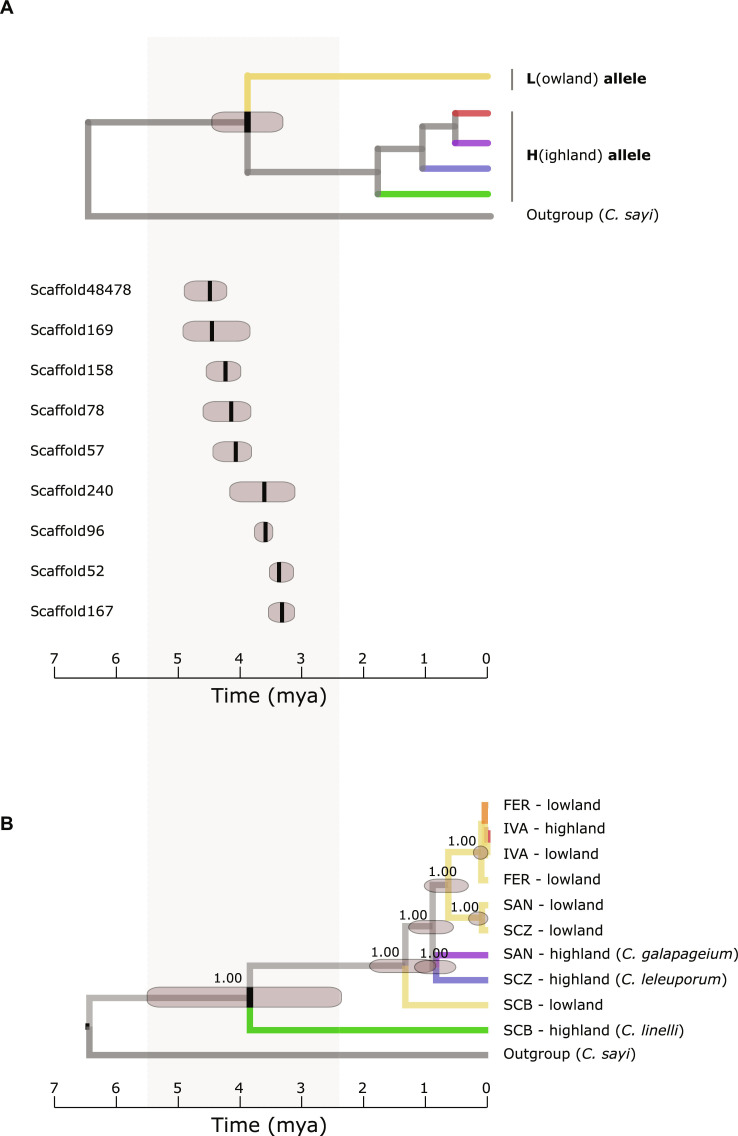
Fig. 6. Estimated divergence time between high- and lowland alleles for nine different SVs compared to the estimated divergence time between the species.
(A) Estimated divergence time (black vertical bars: mean; dark gray bars: 95% highest posterior density) between high- and lowland alleles for nine different SVs associated with high-lowland divergence. (B) Estimated divergence times of the different species and populations based on random selection of 50 genomic windows of 20 kb that are located outside the SV. Node values represent posterior probabilities of the clades. Divergence times in both panels are expressed in mya using the divergence from the most closely related extant mainland species C. sayi as calibration point.

