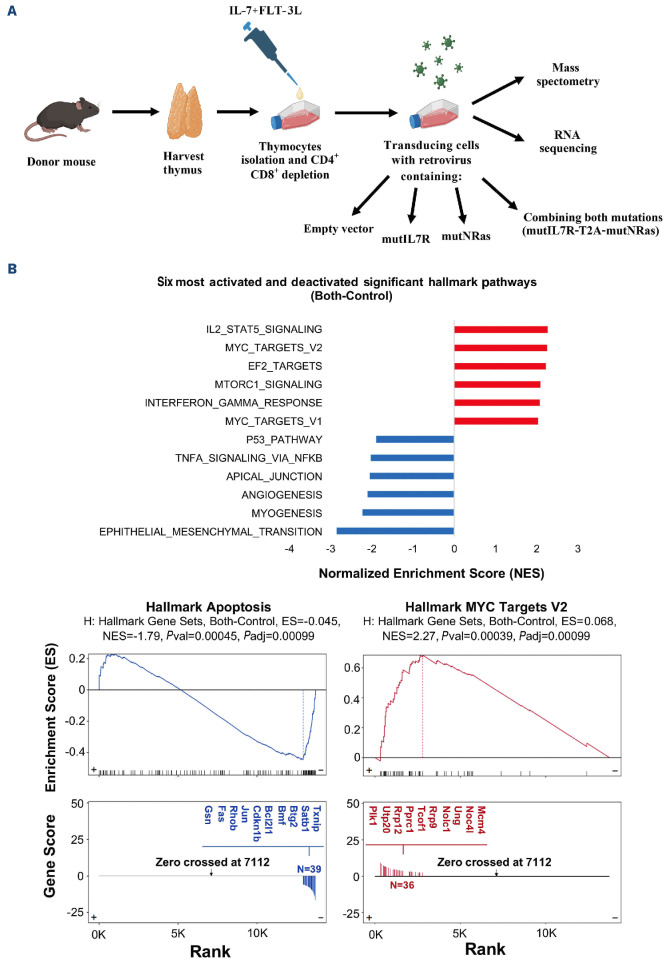
Figure 1.
Identifying the molecular pathway that leads to acute lymphoblastic leukemia caused by mutIL7R and mutNRAS. (A) Schematic diagram describing the experimental design for conducting mass spectrometry and RNA sequencing. (B) (Top) Bar chart showing the top 6 GSEA Hallmark pathways in mutIL7R + mutNRAS relative to control empty vector. The x-axis shows normalized enrichment scores, with activated pathways given red bars and deactivated pathways in blue. (Bottom) GSEA enrichment plots for both the deactivated HALLMARK_APOPTOSIS pathway and the activated HALLMARK_MYC_TARGETS_V2 pathway. Both P values (Pval) and adjusted P values (Padj) are shown.

