Figure 6.
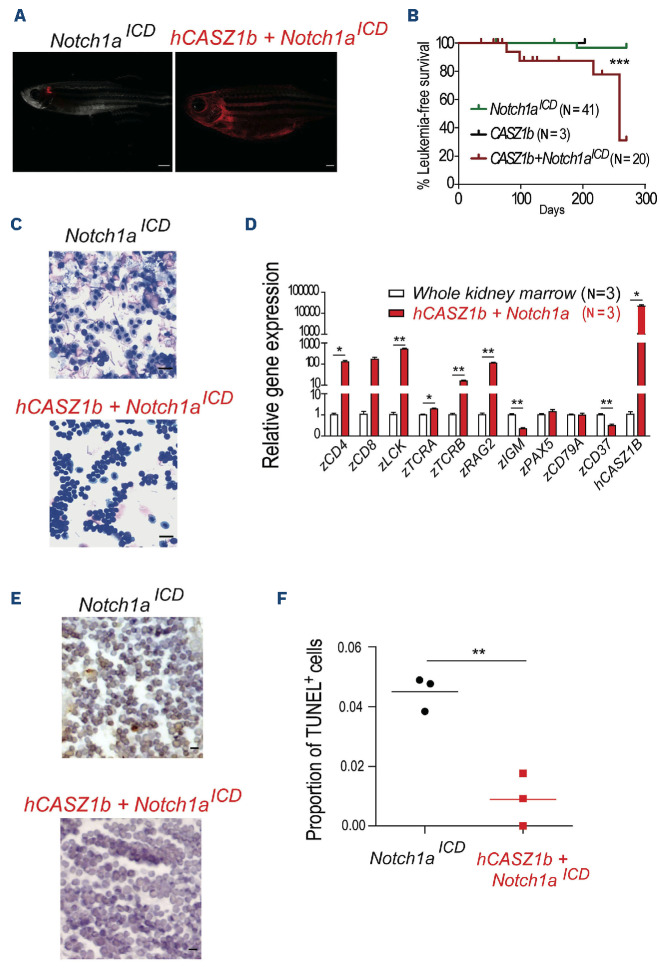
CASZ1 cooperates with NOTCH1 to drive T-cell leukemogenesis in transgenic zebrafish. Tu/AB strain embryos were injected at one cell stage with rag2:notch1aICD, rag2:h-CASZ1b or a mixture of both. (A) Images representative of mosaic transgenic zebrafish at 77 days post injection. (B) Kaplan-Meier analysis of leukemic fish comparing Notch1aICD (N=15), hCASZ1b (N=3, sacrificed at 203 days without evidence of disease) and hCASZ1b + Notch1aICD (N=20). ***P<0.001, log-rank (Mantel-Cox) test. (C) May-Grünwald and Wright-Giemsa stained cytospins showing lymphoblast morphology; 400x magnification. Images are representative of at least 3 independent fish analyzed of each genotype up to 100 days post injection. Scale bar equals 10 µm. (D) Transcript levels of the indicated genes were determined by quantitative polymerase chain reaction (qPCR) and normalized to β-actin. The values were further normalized to the control condition (whole kidney marrow) and represent the mean ± standard deviation of at least 2 independent replicates. (E) Representative hematoxylin- and eosin-stained histological sections juxtaposed to immunohistochemistry for TUNEL. Scale bar equals 10 μm. (F) Values are the quantification of the immunohistochemistry data represented in (E). * P<0.05; **P<0.01, student’s t test.

