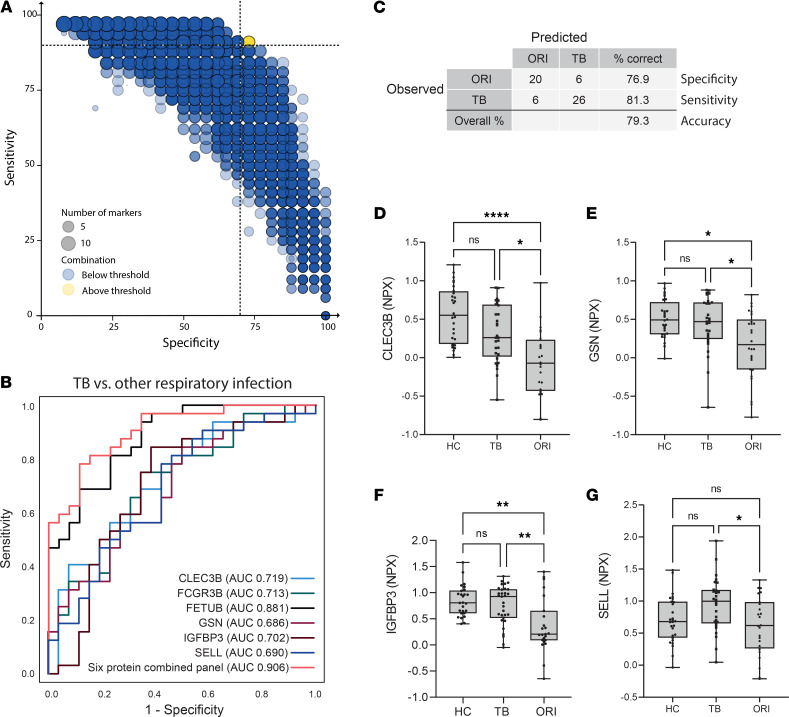
Figure 10. A 6-protein biomarker panel distinguishes pulmonary TB from other respiratory infections.
(A) Bubble plot of possible protein combinations within the 14 proteins showing significant differential expression between TB and ORI groups, generated using the CombiROC R package. Dotted lines at 90% sensitivity and 70% specificity corresponding to the WHO Target Product Profile for a triage test for active TB. (B) Receiver operating characteristic (ROC) curve of best-performing biomarker combination and constituent proteins. The 6-protein combined panel AUC = 0.906 (95% CI: 0.83–0.908). (C) Classification grid illustrating diagnostic performance of the 6-protein biomarker panel in the validation cohort demonstrating a sensitivity of 81.3% (95% CI: 63.0%–92.1%), specificity of 76.9% (95% CI: 56.0%–90.2%), and correct classification in 79.3% of cases. (D–G) Box-and-whisker plots of protein biomarkers significantly differentially expressed in TB compared with other respiratory infections by proximity extension assay. Box-and-whisker plots of FCGR3B and FETUB are shown in Figure 8. Boxes show mean values and interquartile ranges and whiskers show minimum to maximum values. NPX, normalized protein expression (log2 scale); AUC, area under the curve; HC, healthy control; TB, tuberculosis; ORI, other respiratory infections; CLEC3B, tetranectin; GSN, gelsolin; IGFBP3, insulin-like binding protein 3; SELL, L-selectin; FCGR3B, low-affinity immunoglobulin receptor 3B; FETUB, fetuin-B. NS, P > 0.05; *P ≤ 0.05; **P ≤ 0.01, ****P ≤ 0.0001.

