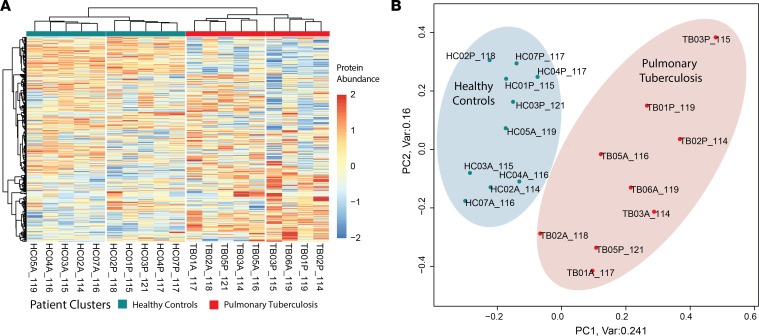
Figure 3. Summary data overview by unsupervised analysis.
(A) Clustered heatmap for log2-transformed fully quantified protein abundances (n = 594) shows clear separation of protein abundances between the HC and pulmonary TB groups. iTRAQ tags and clinical groups are indicated. Within HCs, distinct clustering was observed for discovery cohorts of different ethnicity (sample identification: A = South African, P = Peru). This was also observed within the TB group, although some overlap occurred. (B) Principal component analysis (PCA) of log2-transformed protein abundances demonstrates clear separation by clinical group, responsible for 24% of the variance within the data set. HC, healthy control; iTRAQ, isobaric tags for relative and absolute quantification; TB, tuberculosis.

