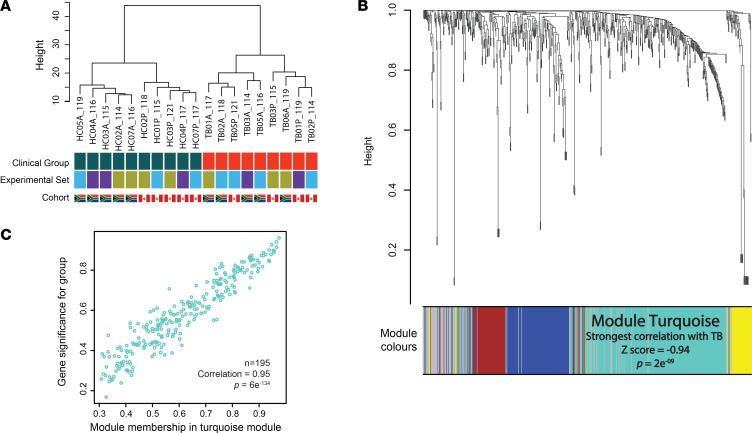
Figure 4. Whole-genome correlation network analysis (WGCNA).
(A) Hierarchical clustering of samples showing discrete clusters by clinical group and absence of clustering by experimental batch. Discrete clustering by cohort ethnicity is again observed in the HC group, but not in TB patients. (B) Protein dendrogram and module colors. Module turquoise, containing 195 proteins, had the strongest correlation with TB (correlation [z] score –0.94, P = 2 × 10⁹). (C) A scatterplot of protein significance by clinical group confirming very high correlation of module turquoise with clinical group (0.95, P = 6 × 10–134). HC, healthy control; TB, tuberculosis.

