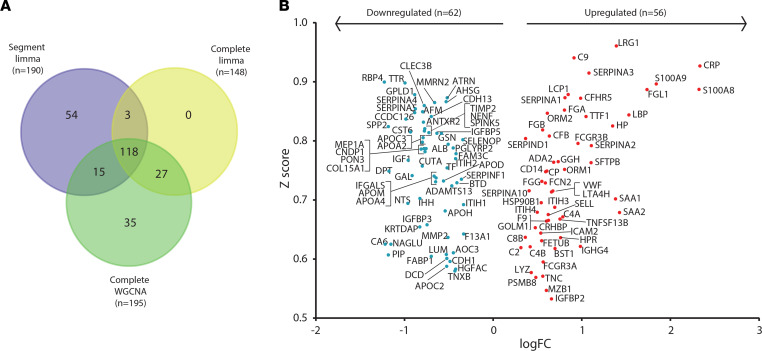
Figure 5. Complementary bioinformatic analyses identify 118 significantly differentially expressed plasma proteins in TB.
(A) Proteins identified by each bioinformatic approach: 190 from limma analysis of segmental plasma proteomes, 148 by limma analysis of complete plasma proteomes, and 195 proteins within WGCNA module turquoise. One hundred and eighteen proteins were found to be significantly differentially expressed via all 3 analytical approaches. (B) Volcano plot of all 118 significantly differentially expressed proteins by log2(fold change) by limma and correlation (z) score from WGCNA. Markers in the upper outer quadrants have the highest fold changes and strongest correlation to TB. All markers have a P value of less than 0.05 after adjustment for multiple testing within limma. limma, linear modeling for microarray data (R package); WGCNA, whole-genome correlation network analysis.

