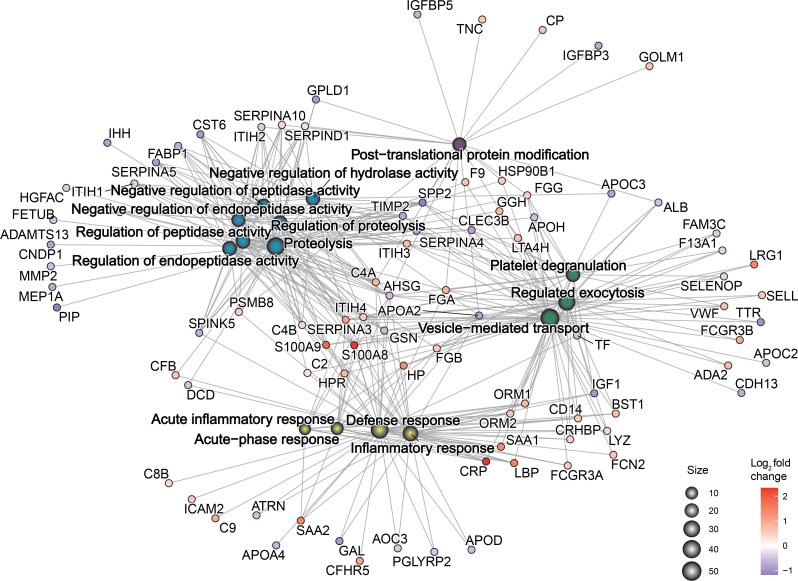
Figure 7. Physiological changes in TB are reflected in the plasma proteome.
Functional enrichment analysis by biological process was performed on the 118 differentially expressed plasma proteins in TB. The gene concept network plot depicts the top 15 most enriched biological processes and their links to divergently regulated proteins. Gene ontology enrichment was performed using ShinyGO and the plot was generated using the cnetplot function in the R package GOplots.

