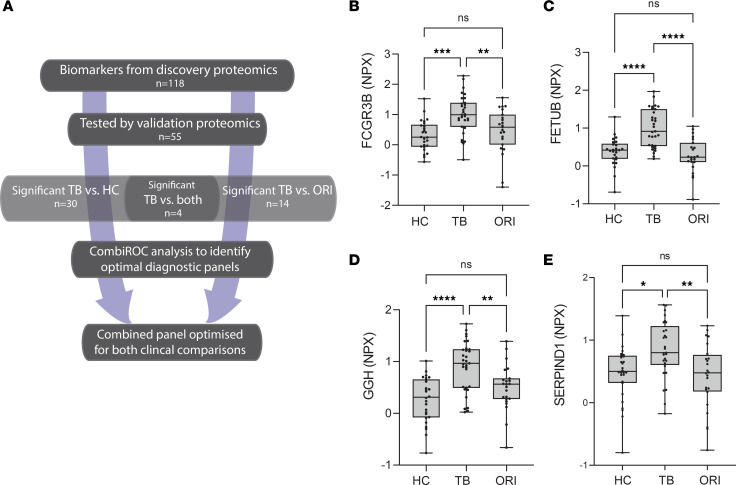
Figure 8. Discovery biomarker candidates validated by proximity extension analysis identify TB-specific biomarkers.
(A) Flow chart outlining the analysis approach to identify significant biomarkers and the best-performing biomarker combinations from our integrated proteomics approach. (B–E) Box-and-whisker plots of 4 protein biomarkers significantly differentially expressed in TB compared with both HCs and ORI by proximity extension assay. Boxes show median values and interquartile ranges and whiskers show minimum to maximum values. Statistical differences were calculated using 1-way ANOVA with Tukey’s multiple-comparison test for data with a Gaussian distribution and Kruskal-Willis test with Dunn’s multiple-comparison test for nonparametrically distributed data. NPX, normalized protein expression (log2 scale); AUC, area under the curve; HC, healthy control (n = 30); TB, tuberculosis; (n = 32); ORI, other respiratory infections (n = 26); FCGR3B, low-affinity immunoglobulin receptor 3B; FETUB, fetuin-B; GGH, γ-glutamyl hydrolase; SERPIND1, serpin D1, also known as heparin cofactor 2. NS, P > 0.05; *P ≤ 0.05; **P ≤ 0.01, ***P ≤ 0.001; ****P ≤ 0.0001.

