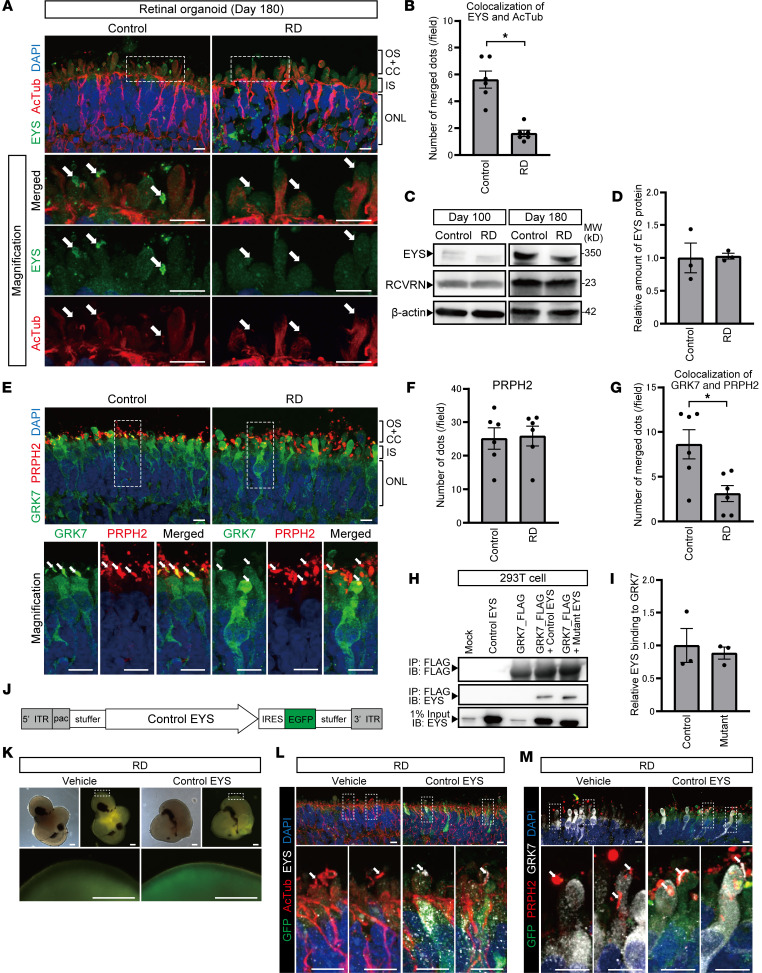
Figure 3. RD retinal organoids exhibited mislocalization of EYS and GRK7 in connecting cilia and outer segment.
(A) Representative immunofluorescence images of EYS and acetylated α-tubulin (AcTub) in control and RD retinal organoids on day 180. Lower panels are higher-magnification images of the dotted boxes in the upper panels. White arrows indicate the CC and nascent OS. Scale bars: 10 μm. (B) Quantitative analysis of merged immunoreactivity of EYS and AcTub in control and RD retinal organoids. The y axis indicates the number of merged dots per field. Data represent mean ± SEM (n = 6 organoids). An unpaired, 2-tailed t test was used for statistical comparison (*P < 0.05). (C) Western blot analysis of EYS and RCVRN in control and RD retinal organoids on day 100 and day 180. Full-length pictures of the blots are presented in Supplemental Figure 8, A–F. (D) Quantification of Western blot bands in C. The y axis indicates the relative amount of intracellular EYS protein. Data represent mean ± SEM from independent experiments (n = 3). An unpaired, 2-tailed t test was used for statistical comparison (P = 0.92). (E) Representative immunofluorescence images of GRK7 and OS marker PRPH2 in control and RD retinal organoids on day 180. Lower panels are higher-magnification images of the dotted boxes in the upper panels. White arrows indicate the OS region. Scale bars: 10 μm. (F) Quantitative analysis of PRPH2 immunoreactivity in control and RD retinal organoids in E. The y axis indicates the number of reactive dots per field. Data represent mean ± SEM (n = 6 organoids). An unpaired, 2-tailed t test was used for statistical comparison (P = 0.87). (G) Quantitative analysis of merged immunoreactivity of PRPH2 and GRK7 in control and RD retinal organoids in E. The y axis indicates the number of reactive dots per field. Data represent mean ± SEM (n = 6 organoids). An unpaired, 2-tailed t test was used for statistical comparison (*P < 0.05). (H) Biochemical interactions between EYS and GRK7. 293T cell lysates were subjected to immunoprecipitation (IP) using anti-FLAG antibody and immunoblotted (IB) with antibodies against FLAG (top) or EYS (middle and bottom). A full-length picture of the blot is presented in Supplemental Figure 9. (I) Quantification of IB bands in H. The y axis indicates the relative amount of control or mutant EYS binding to GRK7. Data represent mean ± SEM from independent experiments (n = 3). An unpaired, 2-tailed t test was used for statistical comparison (P = 0.69). (J) Schematic of helper-dependent adenoviral vector containing control EYS. IRES, internal ribosome entry site; ITR, inverted terminal repeats; pac, packaging signal; stuffer, stuffer DNA. (K) Bright-field and EGFP fluorescence of RD organoids 48 hours after adenoviral infection. Scale bars: 200 μm. (L) Representative immunofluorescence images of GFP, EYS, and AcTub in RD retinal organoids after control EYS introduction with adenoviral vector. Lower panels are higher-magnification images of the dotted boxes in the upper panels. White arrows indicate the CC and nascent outer segment OS. Scale bars: 10 μm. (M) Representative immunofluorescence images of GFP, GRK7, and PRPH2 in RD retinal organoids after control EYS introduction with adenoviral vector. Lower panels are higher-magnification images of the dotted boxes in the upper panels. White arrows indicate the nascent OS. Scale bars: 10 μm.

