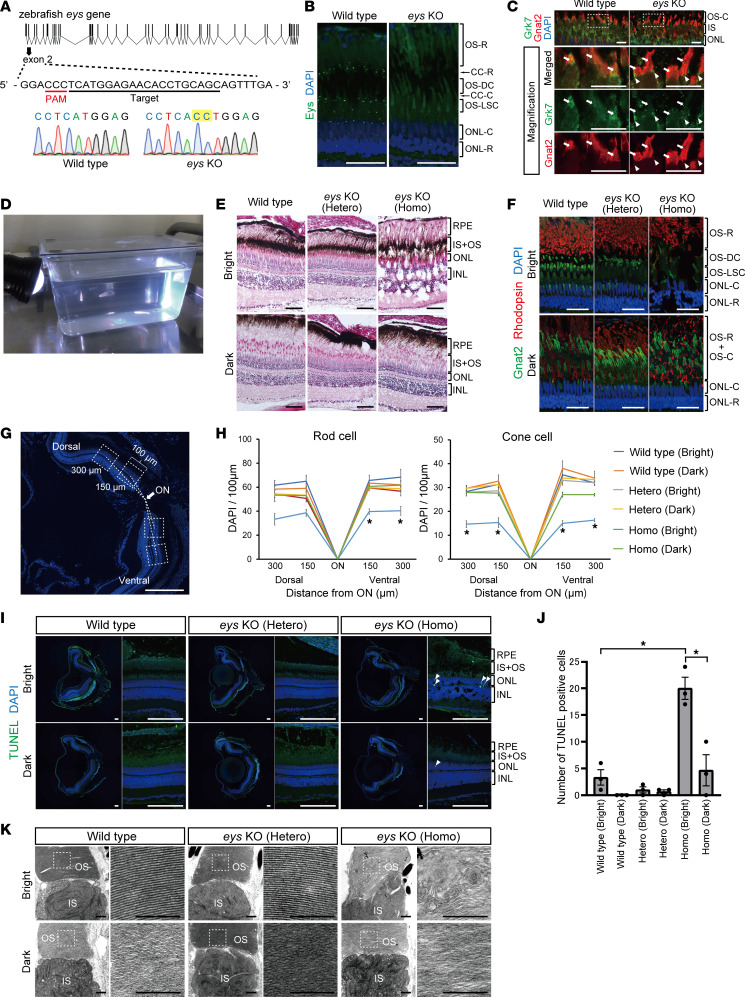
Figure 5. eys-KO zebrafish exhibited GRK7 mislocalization in outer segment and light-induced photoreceptor cell death.
(A) Generation of eys-KO zebrafish with CRISPR/Cas9 technology. The zebrafish eys genomic structure is shown. The protospacer-adjacent motifs (PAMs) and crRNA targeting sequences in exon 2 are underlined. Sanger sequencing identified a 2–base pair insertion in eys-KO zebrafish. (B) Representative Eys immunostaining images of WT and eys-KO zebrafish. No punctate staining in photoreceptor cells was observed in eys-KO zebrafish. CC-C, cone connecting cilium; CC-R, rod connecting cilium; ONL-C, cone outer nuclear layer; ONL-R, rod outer nuclear layer; OS-DC, double cone outer segment; OS-LSC, long single cone outer segment; OS-R, rod outer segment. Scale bars: 20 μm. (C) Images of WT and eys-KO zebrafish immunostained for Grk7 and OS marker Gnat2. Lower panels are higher-magnification images of the dotted boxes in the upper panels. White arrowheads indicate the CC, and white arrows indicate the OS. OS-C, cone outer segment. Scale bars: 10 μm. (D) Three-month-postfertilization WT and eys-KO (heterozygous and homozygous) zebrafish were exposed to white LED light. (E) Retinal sections of WT and eys-KO (heterozygous and homozygous) zebrafish after light stimulation (Bright) or dark adaptation (Dark) were stained with hematoxylin and eosin. Scale bars: 50 μm. (F) Representative immunohistochemistry of light-stimulated or dark-adapted WT and eys-KO (heterozygous and homozygous) zebrafish. Rhodopsin and Gnat2 identify rod OS and cone OS, respectively. Scale bars: 20 μm. (G) Method for counting the number of rod or cone nuclei in light-stimulated or dark-adapted zebrafish. Dotted boxes show areas with a width of 100 μm. Dorsal and ventral areas 150 or 300 μm from the center of optic nerve (ON) were evaluated. Scale bar: 200 μm. (H) Quantification of rod or cone cell numbers by nuclei counting in light-stimulated or dark-adapted WT and eys-KO (heterozygous and homozygous) zebrafish. The x axis indicates the distance from the ON. The y axis indicates the number of nuclei within a range of 100 μm. One-way ANOVA with Dunnett’s post hoc test was used for statistical comparison (*P < 0.05). Data represent mean ± SEM (n = 3). (I) Representative TUNEL staining images of WT and eys-KO zebrafish after light stimulation or dark adaptation. White arrowheads indicate TUNEL-positive cells. Scale bars: 100 μm. (J) The number of TUNEL-positive cells was quantified in each zebrafish after light exposure or dark adaptation. The y axis indicates the number of TUNEL-positive cells per eye. Data represent mean ± SEM (n = 3). One-way ANOVA with Dunnett’s post hoc test was used for statistical comparison (*P < 0.05). (K) Representative transmission electron microscopy images of photoreceptor cells in WT and eys-KO (heterozygous and homozygous) zebrafish. Right panels are higher-magnification images of the OS in the dotted boxes in the left panels. Scale bars: 500 nm.

