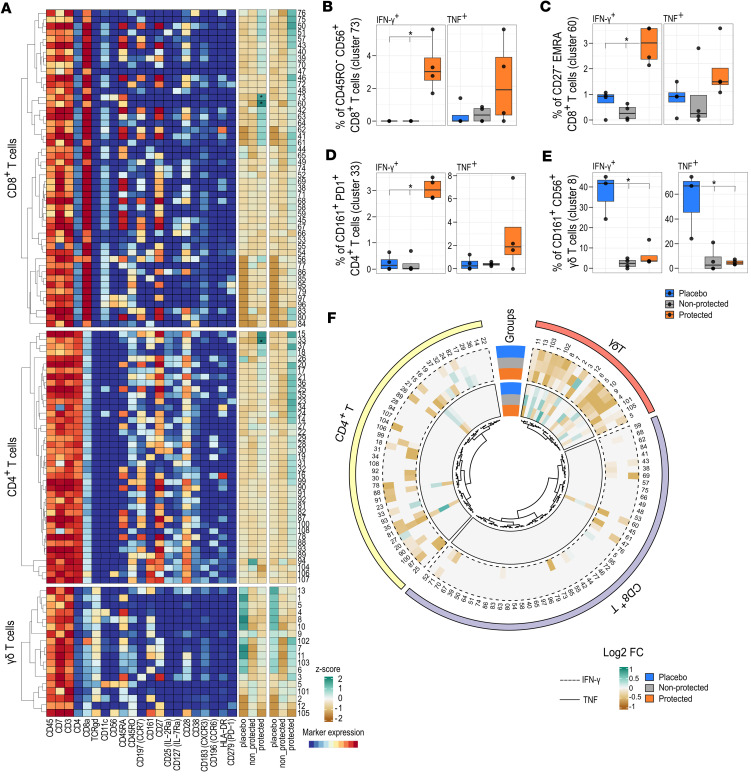
Figure 5. Cytokine response to PfRBC stimulation.
(A) The heatmap on the left shows the expression of markers as median signal intensity after arsinh transformation for CD8+, CD4+, and γδ T cells. Each cluster has a unique number. The heatmap on the right shows the summary of Z scores of the normalized frequency of cells producing IFN-γ and TNF per cluster (after subtraction of uRBCs) in placebo (n = 4), nonprotected (n = 4), and protected (n = 4) groups at baseline. The colors indicated represent the mean Z score per cluster per group. (B) Frequency of IFN-γ– and TNF-producing CD56+CD8+ T cells (cluster 73), (C) EMRA CD8+ T cells (cluster 60), (D) CD161+ EM CD4+ T cells, and (E) CD56+ γδ T cells, given as a percentage of parents among the indicated groups. The data are presented as box plots showing the median, the first, and the third quantile, and whiskers extend to the maximum/minimum, no further than 1.5 times the interquartile range (IQR). *P ≤ 0.05, computed using the generalized linear mixed models (GLMM) for binomial family. (F) Circos heatmap showing the log2 FC of IFN-γ– (dashed line) and TNF-producing (full line) cells from c–1 to d11.

