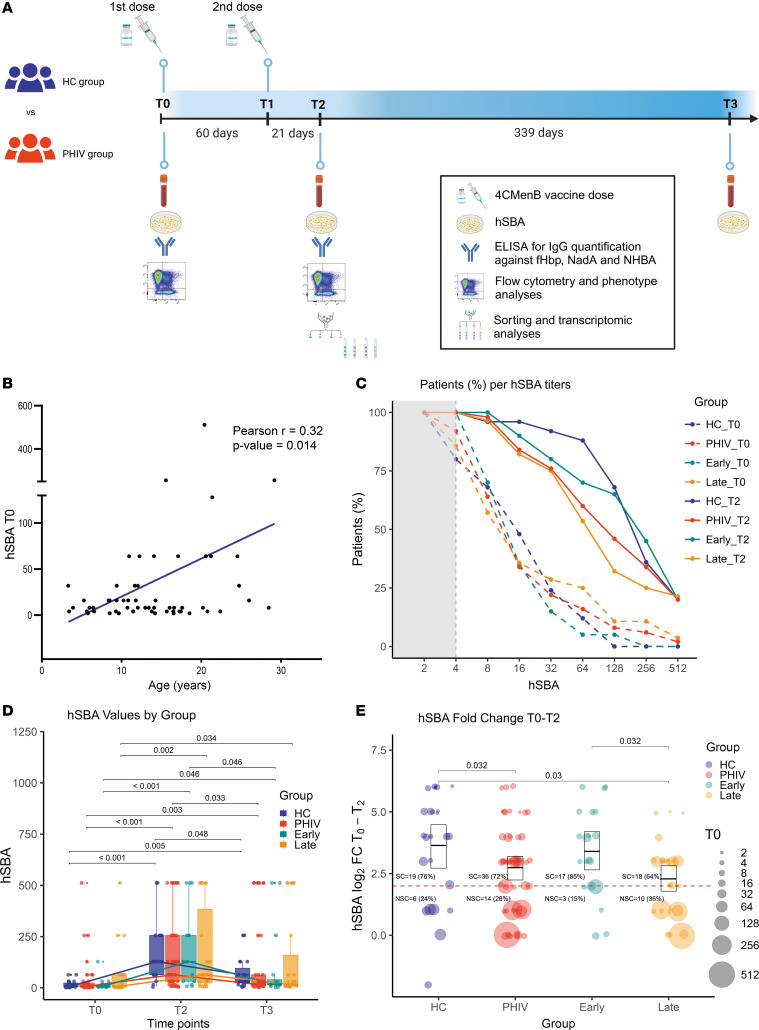
Figure 1. 4CMenB vaccine elicits hSBA response in PHIV and HC participants.
hSBA titers were measured in the sera of participants at T0, T2, and T3. (A) Study design. (B) Pearsonʼs correlation analyses between baseline hSBA values and age at T0. Regression line is reported in blue (n = 63). (C) Line plot reporting the percentage of participants per hSBA level at T0 (dashed lines) and T2 (solid lines) for HC (n = 25, blue) and PHIV (n = 50, red) groups and early-treated (n = 20, cyan) and late-treated (n = 28, orange) PHIV individuals. Gray dashed line marks the threshold of seroprotection (hSBA T0 = 4), with gray area showing nonseroprotection. (D) Longitudinal analyses of hSBA titer (±95% CI) in HC (n = 19, blue), PHIV (n = 39, red), and early-treated (n = 16, cyan) and late-treated (n = 23, orange) individuals pre- (T0) and postvaccination (T2–T3). The lines represent the median values of HC (blue), PHIV (red), and early-treated (cyan) and late-treated (orange) individuals. (E) Log2 hSBA titer fold-change (FC) (±95% CI) in HC (n = 25, blue), PHIV (n = 50, red), and early-treated (n = 20, cyan) and late-treated (n = 28, orange) participants following vaccination. The size of the points represents the hSBA value at T0. The dashed line represents the threshold of protection (FC ≥ 4); numbers and percentage of seroconverter (SC) and nonseroconverter (NSC) participants are reported for each group. Box plot midlines report the median, with the upper and lower limits of the box being 75th and 25th percentile, respectively. Whiskers represent 1.5 IQR. Comparison of hSBA distributions between groups and time points was evaluated by 2-way ANOVA followed by pairwise t test if both distributions were normal, or conversely, with Kruskal-Wallis test followed by Dunn’s test. FDR-adjusted P values less than 0.05 are reported.

