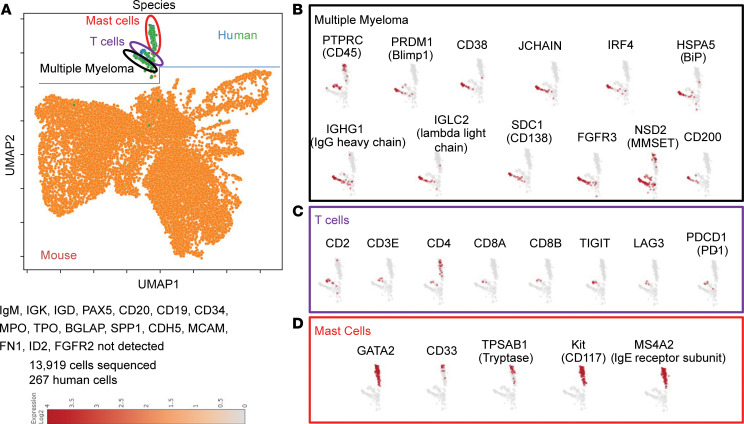
Figure 4. Characterization of NSG+hIL6 myeloma-engrafted mice.
BM from an NSG+hIL6 mouse engrafted with mononuclear human BM cells from patient sample R/R MM3 was isolated 52 weeks after intraosseous injection and subjected to scRNA-seq using the Parse Biosciences processing and analysis pipeline. (A) Uniform manifold approximation and projection (UMAP) denotes the presence of mouse cells (orange) and human cells (green and blue). Human cells form 3 clusters. Gene expression profiles define these as (B) myeloma cells (black), (C) T cells (purple), and (D) mast cells (red). The data herein represent scRNA-seq from 1 mouse engrafted with 1 human MM sample.

