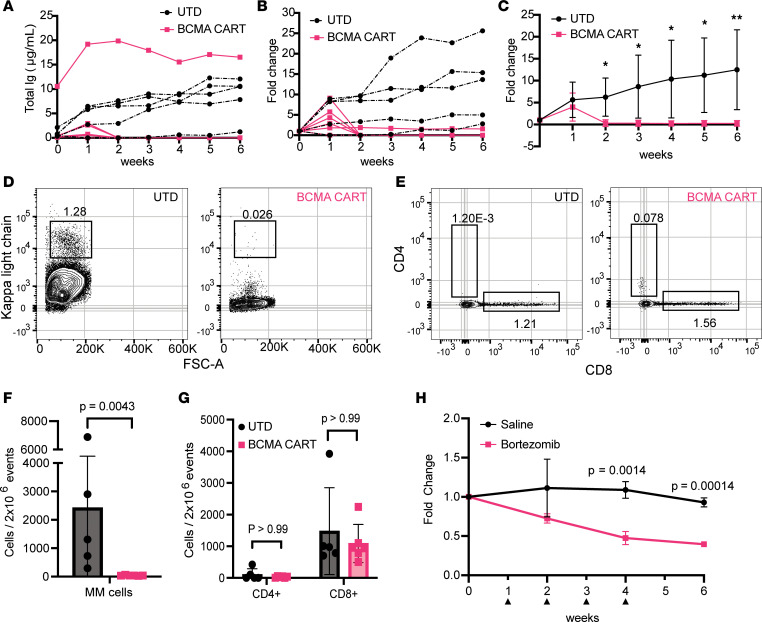
Figure 8. Responses to BCMA-CART or bortezomib.
(A–G) NSG+hIL6 mice were implanted with BM cells from an untreated newly diagnosed Igκ+ MM patient. Fourteen weeks later (week zero), serum Ig+ mice were given a single dose of human BCMA-CART cells (pink, n = 6) or untransduced T cells (UTD) from the same normal donor (black, n = 5). Sera were analyzed by ELISA for human Ig weekly over 6 weeks (A–C). Shown are total Ig levels (A), fold change over time (B), and aggregate fold change data for each group (C). *P < 0.05, **P < 0.005. For A and B, each line derives from an individual host. (D and E) Representative flow cytometric plots on week 6 for Igκ+ (D) or CD4+ and CD8+ T cells (E) among BM cells in recipients of UTD or BCMA-CART cells as indicated. Igκ-versus-FSC plots are pregated on viable CD19– and CD3– events; CD4+ versus CD8+ T cell plots are pregated on viable CD3+ events. (F and G) Means and standard deviations for Igk+ (F) or CD8+ T cells (G) on week 6. (H) Separate experiment wherein serum human IgG+ NSG+hIL6 mice were given 4 doses (black arrowheads) of saline (black, n = 3, 10 μL/g) or bortezomib (red, n = 3, 1 mg/kg i.v.) over 4 weeks. Statistics were calculated with 2-tailed Mann-Whitney t tests.

