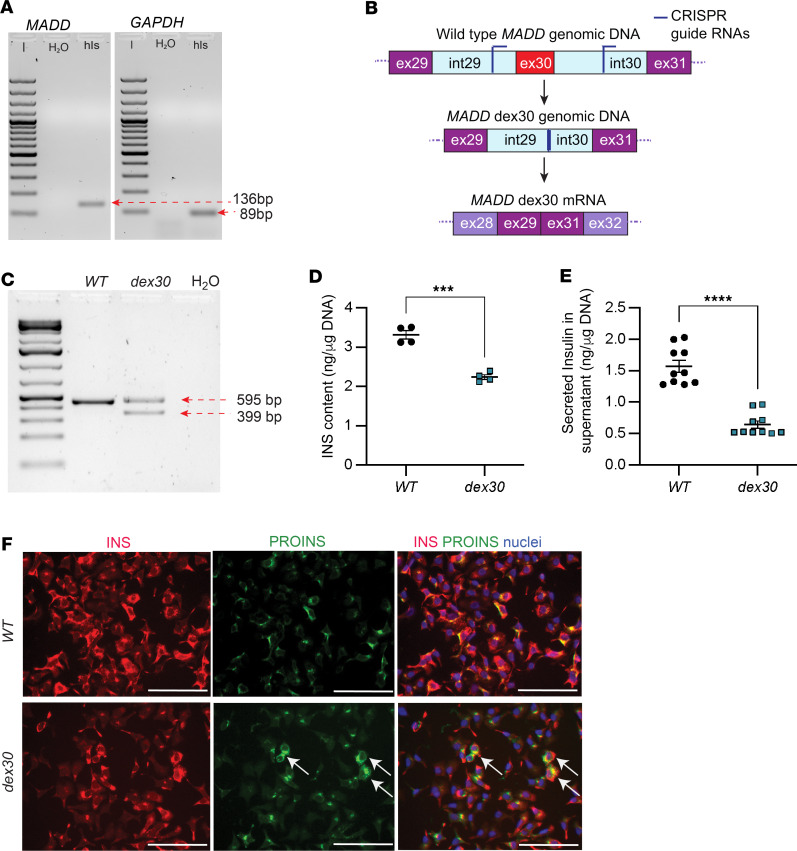
Figure 2. Dex30 leads to reduced insulin expression in EndoC-βH1 cells.
(A) MADD and GAPDH mRNA expression in human pancreatic islets. The lanes with MADD and GAPDH RT-PCR products were run on the same gel but were noncontiguous. Lanes from the same gel are shown in Supplemental Figure 5. hIs, human islets. (B) A schematic showing the genome-editing strategy used for generating dex30 cells. (C) PCR with MADD genomic DNA around exon 30 in WT and dex30-enriched EndoC-βH1 cells. Expected product sizes: WT 595 bp, dex30 399 bp. (D) Insulin content in WT and dex30 EndoC-βH1 cells. n = 4. (E) Insulin secreted to culture media during 24 hours from WT and dex30 EndoC-βH1 cells. n = 10. (F) Immunostaining with antibodies specific to insulin (red) and proinsulin (green) in WT and dex30 EndoC-βH1 cells. Arrows indicate cells with accumulation of proinsulin. Scale bars: 100 μm. ****P < 0.0001, ***P < 0.001, analyzed by Student’s t test.

