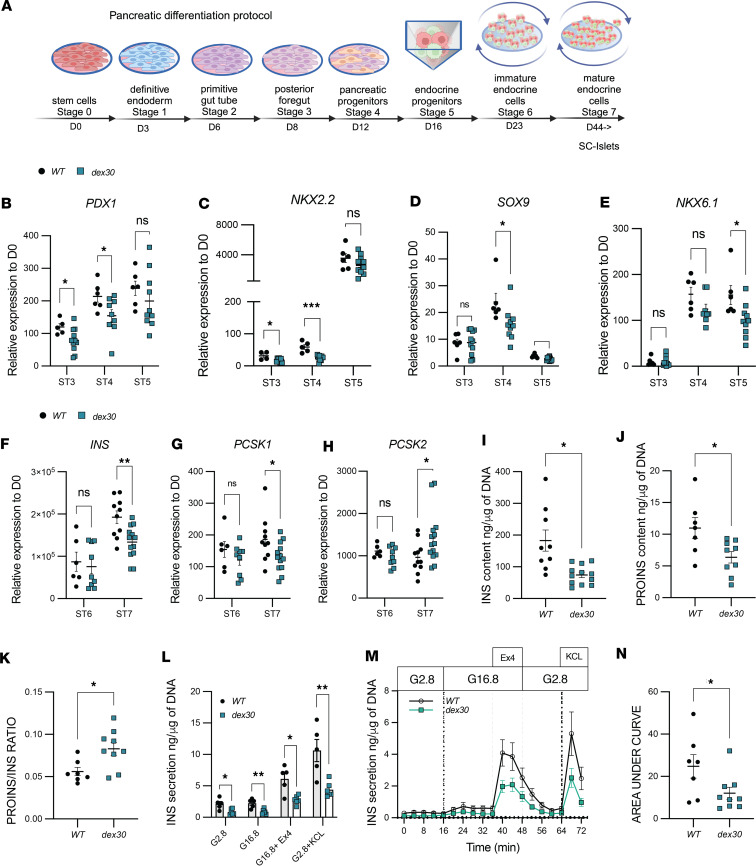
Figure 3. Dex30 leads to reduced number of β cells, lowered insulin content, and impaired insulin processing in SC-islets.
(A) Schematic of SC-islet differentiation protocol. (B) PDX1, (C) NKX2-2, (D) SOX9, and (E) NKX6-1 mRNA levels in WT and dex30 cultures at stages 3–5, relative to undifferentiated stem cells (n = 4–6 for WT, n = 8–11 for dex30). (F) INS, (G) PCSK1, and (H) PCSK2 mRNA levels in WT and dex30 cultures at stages 6–7, relative to undifferentiated stem cells (n = 6 for WT, n = 9 for dex30 at ST6, n = 10 for WT, and n = 13–14 for dex30 at stage 7). (I) Total insulin and (J) proinsulin content in WT and dex30 SC-islets at stage 7 (n = 7–9 for WT, n = 9–12 for dex30). (K) Proinsulin-to-insulin ratio in WT and dex30 SC-islets at stage 7 (n = 7 for WT, n = 9 for dex30). (L) Static insulin secretion from WT and dex30 SC-islets at stage 7, in 2.8 mM glucose (G2.8), 16.8 mM glucose (G16.8), 16.8 mM glucose + 50 mM Exendin 4 (Ex4), and 2.8 mM glucose with 30 mM KCl (n = 5 for WT, n = 6 for dex30). (M) Dynamic insulin secretion in WT and dex30 SC-islets at stage 7. Conditions like in L (n = 7 for WT, n = 9 for dex30). (N) Area under curve quantification of dynamic insulin secretion in M. ***P < 0.001, **P < 0.01, and *P < 0.05 analyzed by Student’s t test (I–K and N) or multiple t tests (B–H and L).

