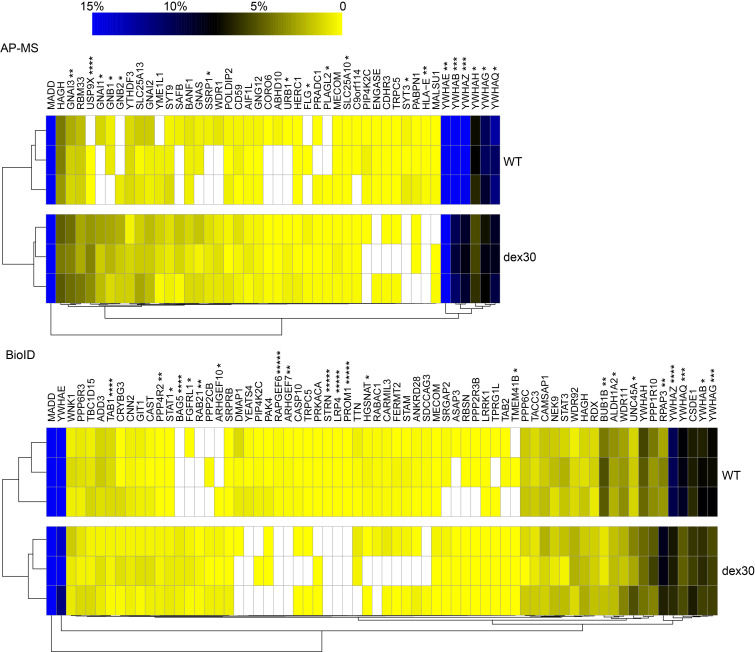
Figure 7. Dex30 leads to changes in the interactome of MADD.
Hierarchical clustering of the quantitated stable (AP-MS) and transient (BioID) high-confidence interactions of WT and dex30 MADD from 3 replicates. The color gradient (0%–15%) illustrates the normalized abundances of the interactors relative to MADD bait protein. Interactions with significant differences between WT and dex30 MADD are marked with asterisk (*****P < 0.00001, ****P < 0.0001, ***P < 0,001, **P < 0.01, *P < 0.05 analyzed by Student’s t test).

