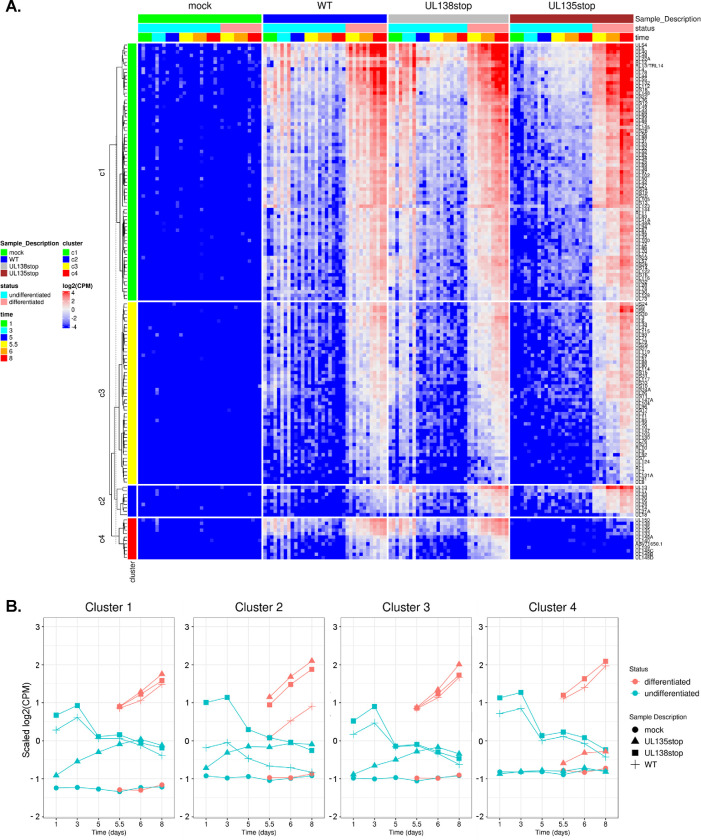
Figure 2. Viral genes cluster into distinct patterns of regulation during latency and reactivation.
A) Clustering analysis was performed using the k-means approach and viral gene expression was visualized via heatmap with the ComplexHeatmap package from R (64, 65). Data were scaled to log2 CPM as a function of gene count. B) Average viral gene expression for each treatment group is shown by viral gene cluster.

