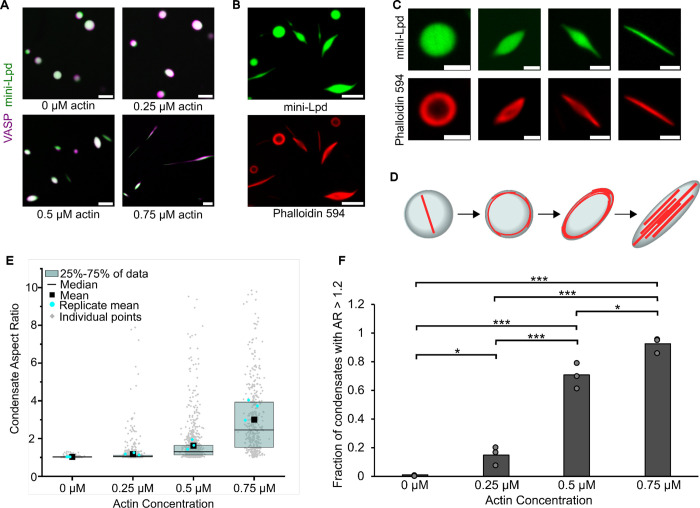
Figure 3. Condensates of VASP and mini-Lpd polymerize and bundle actin in the absence of crowding agents.
A) Condensates formed from 5 μM mini-Lpd (green) and 10 μM VASP (magenta) are increasingly deformed with the addition of increasing concentrations of G-actin (unlabeled). Scale bars 5 μm B) Phalloidin-iFluor-594 (red) staining of mini-Lpd (green) and VASP (unlabeled) condensates with 0.5 μM monomeric G-actin displaying rings and rods of polymerized actin within the protein condensates. Scale bars 5 μm. C) From left to right: representative confocal images depicting the progression of condensate deformation as actin polymerizes and bundles within the protein condensates. Scale bars 2 μm D) Cartoon depicting the mechanism of actin polymerization within protein condensates and the role it plays in condensate deformation. E) Distribution of condensate aspect ratios across the conditions in A, with at least 400 condensates analyzed for each condition, and more than 800 condensates were analyzed for the 0, 0.25, and 0.5 μM conditions. In the 0.75 μM actin condition values for aspect ratios above 10, corresponding to 4.8% of the data, are not displayed to better visualize distributions for all conditions. The mean indicates the mean of all data points in each condition, while the replicate mean is the mean of each of the individual replicates for each condition. F) Quantification of the fraction of elongated protein condensates, defined as condensates with aspect ratios > 1.2, across the conditions in A. Data are mean across three independent experiments with at least 400 condensates analyzed per condition, and more than 800 condensates were analyzed for the 0, 0.25, and 0.5 μM conditions. Overlayed gray circles denote the means of each replicate. One asterisk denotes p<.05, three asterisks denote p<.001 using an unpaired, two-tailed t-test on the means of the replicates N=3. All experiments were performed in a buffer containing 20 mM Tris (pH 7.4), 150 mM NaCl, and 5 mM TCEP in the absence of PEG.

