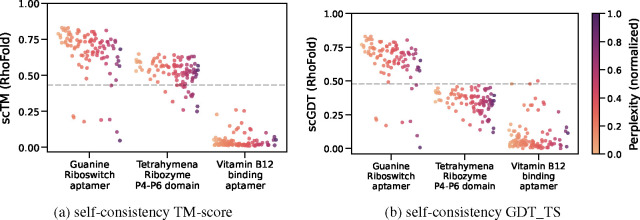
Figure 8: 3D self-consistency scores for 3 representative RNAs from Das et al. [2010].
We use RhoFold to ‘forward fold’ 100 designs sampled at temperature = 0.5 and plot self-consistency TM-score and GDT_TS. Each dot corresponds to one designed sequence and is coloured by gRNAde’s perplexity (normalised per RNA). Designs with lower relative perplexity generally have higher 3D self-consistency and can be considered more ‘designable’. Dotted lines represent TM-score and GDT_TS thresholds of 0.45 and 0.50, repsectively. Pairs of structures scoring higher than the threshold correspond to roughly the same fold.

