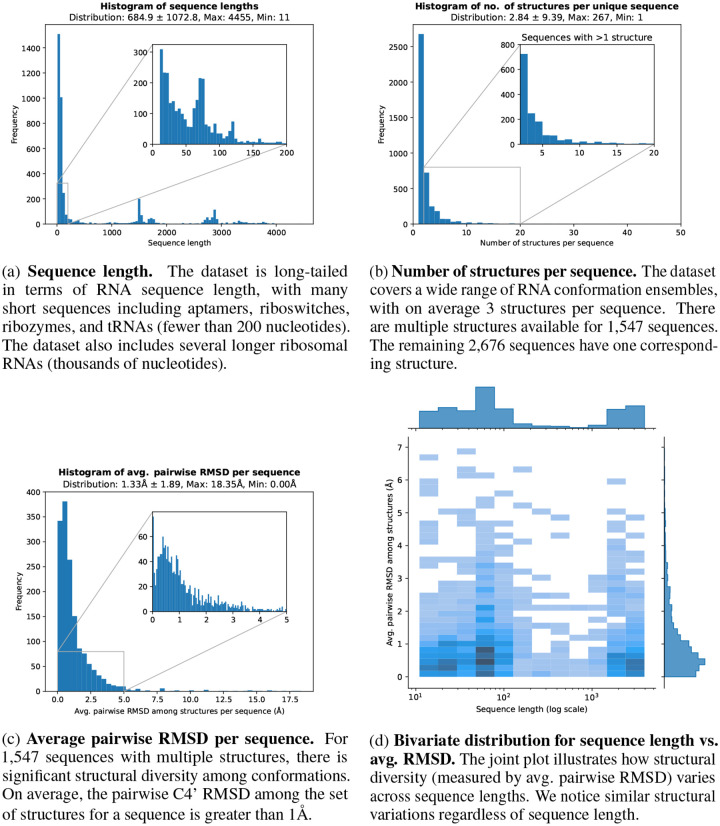
Figure 14: RNASolo data statistics.
We plot histograms to visualise the diversity of RNAs available in terms of (a) sequence length, (b) number of structures available per sequence, as well as (c) structural variation among conformations for those RNA that have multiple structures. The bivariate distribution plot (d) for sequence length vs. average pairwise RMSD illustrates structural diversity regardless of sequence lengths.

