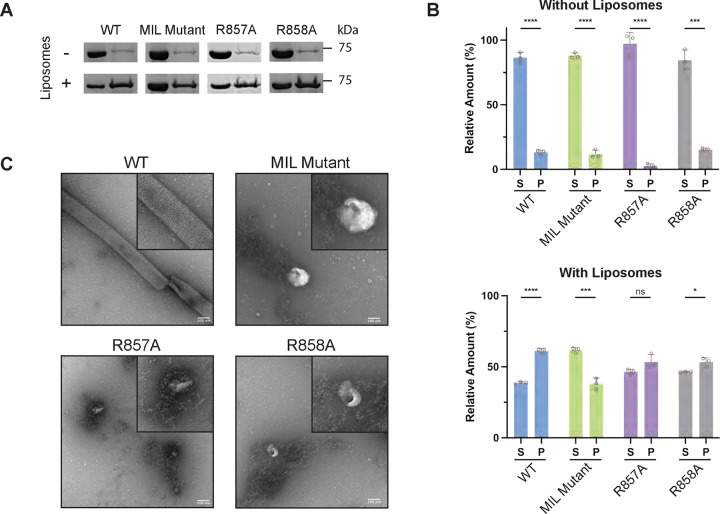
Figure 2. Characterization of key membrane interface residues.
(A) The SDS-PAGE analysis of the co-sedimentation assays with S-OPA1 WT, MIL mutant, R857A, and R858A in the presence and absence of CL-containing liposomes. S, supernatant. P, pellet. (B) The quantification of the bands corresponding to S and P fractions were performed using ImageJ and unpaired two-tailed student T test was calculated from n=3 independent experiments for all data points. The asterisk(s) above the bars indicate the following: P<0.0001 (****), P<0.001 to P>0.0001 (***), P<0.005 to P>0.001 (**), P<0.05 to P>0.005 (*), and P>0.05 (not significant, ns). (C) The reconstitution assays for WT and mutant S-OPA1 samples were visualized by negative-stain TEM. Scale bar is 100 nm.

