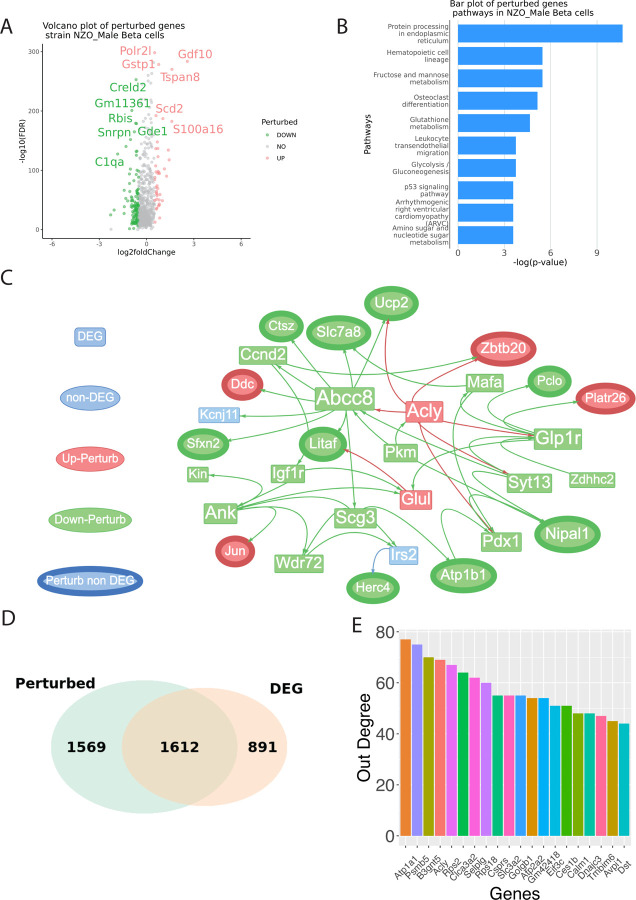
Figure 4: Identification of DEGs and perturbed genes from β-cells of NZO (New Zealand Obese) mice fed on a regular or high-fat, high-sugar diet, explicitly focusing on males.
The diagram details the expression levels of various genes. (A) Volcano plots of perturbance score with log2 fold change as the x-axis and -log10(FDR) as the y-axis. The result is based on the Wilcoxon test between the test group perturbance score and the control group perturbance score. (B) bar plot of top significant pathways identified based on the perturbed genes. (C) Visualization of sub-perturbed network. (D) Venn Diagram of perturbed genes vs. DEGs. (E) Out degree bar plot of highest influential genes in the complete perturbed network.

