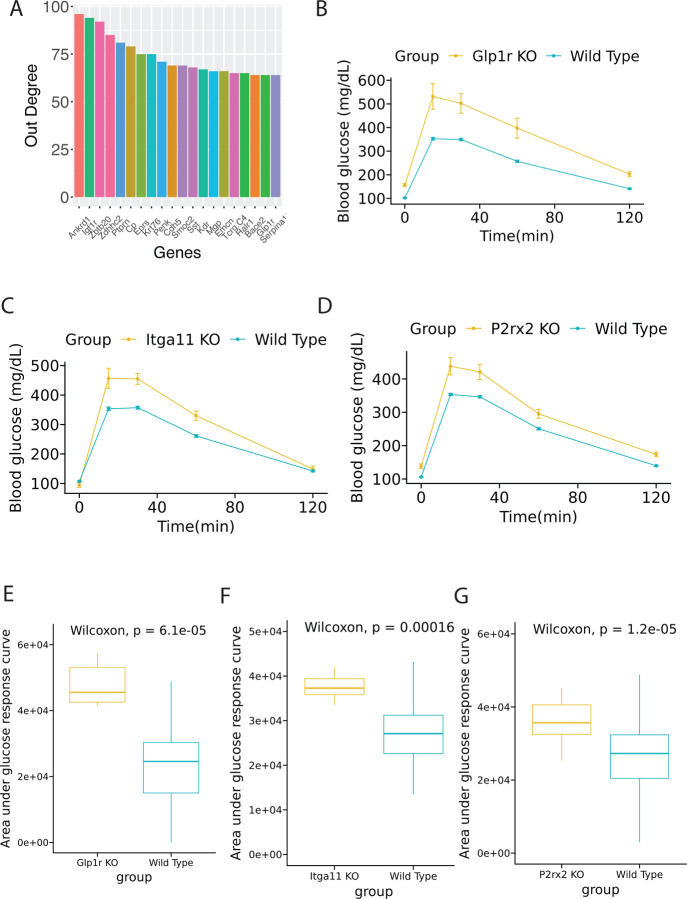
Figure 7: Extended analysis of DEGs and perturbed genes from β-cells of C57BL/6J and NZO mice (males) fed on a high-fat, high-sugar diet.
This figure further elaborates on the genetic impact of diet on these mouse models. (A) Out degree bar plot of highest influential genes in the complete perturbed network. (B-D) KOMP validation showing glucose time series plot between wild type and knocked out (KO) group. (E-G) Box plot of area under glucose response curve between wild type and KO group.

