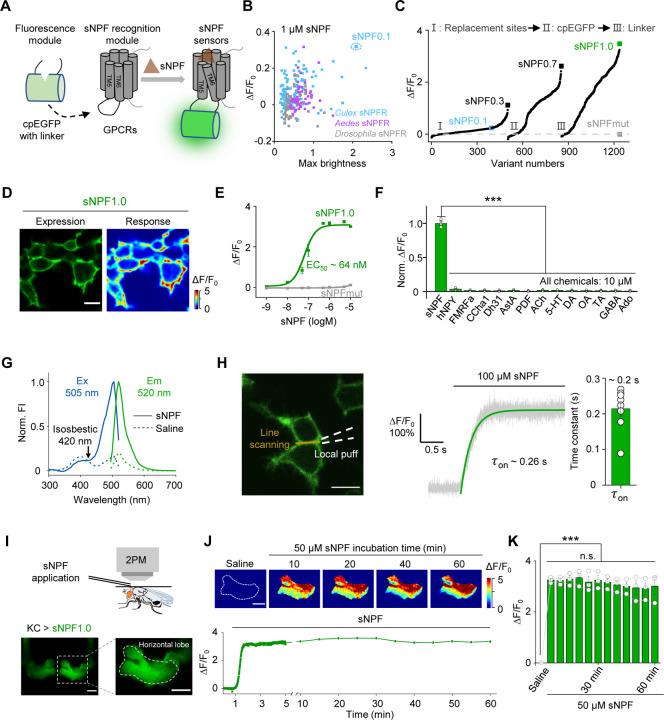
Fig. 1 |. Development and in vitro and in vivo characterization of GRABsNPF sensors.
(A) Schematic diagram depicting the principle behind the GRABsNPF sensors in which ICL3 in the sNPF receptor (sNPFR) is replaced with cpEGFP and linker from GRABNE1m. Binding of sNPF to the sensor induces a conformational change that increases the fluorescence signal.
(B) Selection of a candidate sensor for further optimization in HEK293T cells by screening sNPFRs cloned from the indicated species. The candidate sensor with the strongest response to 1 μM sNPF, GRABsNPF0.1 (sNPF0.1), is indicated.
(C) Optimization of the replacement site, key amino acids in cpEGFP, and linkers between cpEGFP and GPCR in GRABsNPF sensors based on sNPF0.1, yielding increasingly more responsive sensors. The sensor with the strongest response to 1 μM sNPF, GRABsNPF1.0 (sNPF1.0), is indicated.
(D) Representative fluorescence image of sNPF1.0 (left) and pseudocolor image (right) showing the change in sNPF1.0 fluorescence in HEK293T cells expressing sNPF1.0 in response to 1 μM sNPF. Scale bar, 10 μm.
(E) Dose–response curves measured in HEK293T cells expressing sNPF1.0 or sNPFmut, with the corresponding EC50 values; n = 3 wells with 200–400 cells per well.
(F) Summary of normalized ΔF/F0 measured in sNPF1.0-expressing HEK293T cells in response to the indicated compounds; n = 3 wells with 200–400 cells per well. sNPF, Drosophila short neuropeptide F; hNPY, human neuropeptide Y; FMRFa, FMRFamide; CCHa1, CCHamide 1; Dh31, diuretic hormone 31; AstA, allatostatin A; PDF, pigment-dispersing factor; ACh, acetylcholine; 5-HT, 5-hydroxytryptamine; DA, dopamine; OA, octopamine; TA, tyramine; GABA, gamma-aminobutyric acid; Ado, adenosine.
(G) One-photon excitation (ex) and emission (em) spectra of sNPF1.0 measured in the absence and presence of sNPF. The isosbestic point and excitation and emission peaks are indicated. FI, fluorescence intensity.
(H) Summary of the kinetics of the sNPF1.0 response. Left: illustration of the local puffing system. Middle: a representative response trace. Right: group data summarizing τon; n = 8 cells from 3 cultures. Scale bar, 10 μm.
(I) Schematic illustration (top) and fluorescence images (bottom) of a transgenic fly expressing sNPF1.0 in MB KCs. Scale bar, 25 μm.
(J) Representative pseudocolor images (top) and trace (bottom) of ΔF/F0 in response to a 1-hour perfusion of 50 μM sNPF in a transgenic fly expressing sNPF1.0 in MB KCs. Scale bar, 25 μm.
(K) Summary of ΔF/F0 measured in response to 50 μM sNPF at the indicated times; n = 3 flies.
Data are shown as mean ± s.e.m. in h, with the error bars or shaded regions indicating the s.e.m. ***P < 0.001, **P < 0.01, *P < 0.05, and n.s., not significant.

