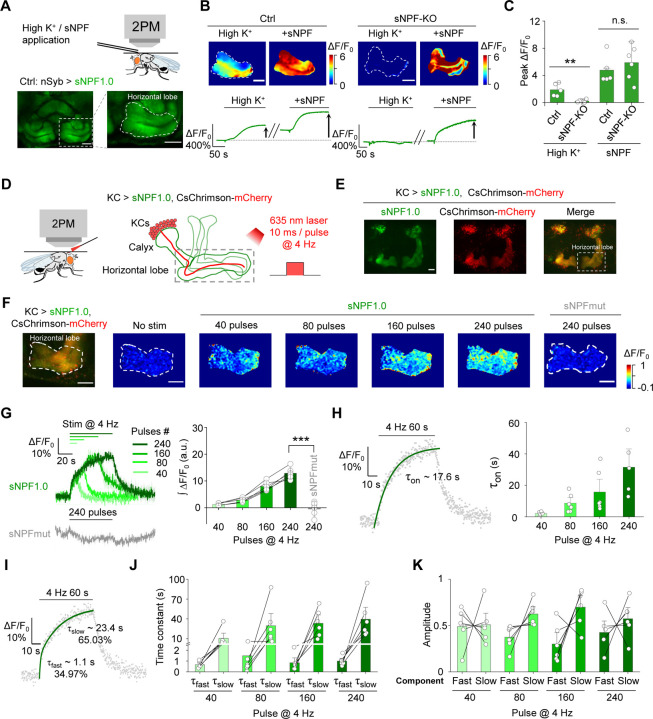
Fig. 2 |. The sNPF1.0 GRAB sensor can detect sNPF release in vivo.
(A) Schematic diagram (top) and representative fluorescence images (bottom) of sNPF1.0 expressed in the horizontal lobe in the Drosophila MB. Scale bar, 25 μm.
(B) Representative pseudocolor images (top) and traces (bottom) of sNPF1.0 expressed in control flies (left) and sNPF KO flies (right); where indicated, high K+ and sNPF were applied. Scale bars, 25 μm.
(C) Summary of peak ΔF/F0 measured in the indicated flies in response to high K+ and sNPF; n = 5–6 flies each.
(D) Schematic illustration depicting the experimental setup. CsChrimson-mCherry and sNPF1.0 were expressed in KCs in the Drosophila MB, and 635-nm laser light pulses were used to optogenetically activate the KCs.
(E) Representative fluorescence images of sNPF1.0 and CsChrimson-mCherry in the MB; the horizontal lobe is indicated by the dashed white box. Scale bar, 25 μm.
(F) Fluorescence image of sNPF1.0 and CsChrimson-mCherry in the horizontal lobe in KCs (left-most image) and representative pseudocolor images (right) of the fluorescence responses of sNPF1.0 and sNPFmut to the indicated number of 635-nm laser pulses applied at 4 Hz. Scale bars, 25 μm.
(G) Traces (left) and summary (right) of the fluorescence responses of sNPF1.0 and sNPFmut; n = 6 flies each.
(H) sNPF1.0 fluorescence was measured before, during, and after a 240-pulse train of 635-nm light. The rise phase was fitted with a single-exponential function (left), and the time constants (τon) are summarized on the right; n = 6 flies.
(I) sNPF1.0 fluorescence was measured before, during, and after a 240-pulse train of 635-nm light, and the rise phase was fitted with a double-exponential function.
(J and K) Summary of the fast and slow time constants (J) and relative amplitudes (K) measured as shown in (I); n = 6 flies
Data are shown as mean ± s.e.m. in g, with the error bars or shaded regions indicating the s.e.m. **P < 0.01, *P < 0.05, and n.s., not significant.

