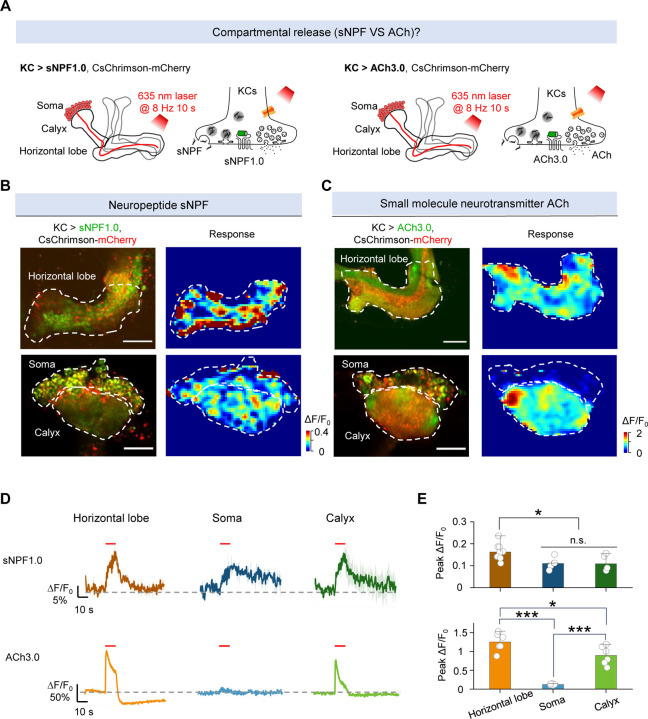
Fig. 3 |. The sNPF1.0 and ACh3.0 GRAB sensors reveal spatial difference in release between sNPF and ACh.
(A) Schematic diagram depicting the KC regions in the Drosophila MB, which can be divided into the axon (horizontal lobe), dendrite (calyx), and soma regions. Also shown is the strategy for imaging sNPF and ACh release in the MB using sNPF1.0 and ACh3.0, respectively. The 100 μM nAChR antagonist mecamylamine (Meca) was present throughout these experiments.
(B and C) Representative fluorescence images (left columns) and pseudocolor images (right columns) showing the change in sNPF1.0 (B) and ACh3.0 (C) fluorescence in response to 80 light pulses delivered at 8 Hz. The top rows show the horizontal lobe, and the bottom rows show the calyx and soma regions (dashed outlines). Scale bars, 25 μm. (D and E) Representative traces (D) and quantification (E) of the change in sNPF1.0 (D, top) and ACh3.0 (D, bottom) fluorescence in response to 80 light pulses delivered at 8 Hz.
Data are shown as mean ± s.e.m. in d, with the error bars or shaded regions indicating the s.e.m. ***P < 0.001, *P < 0.05, and n.s., not significant.

