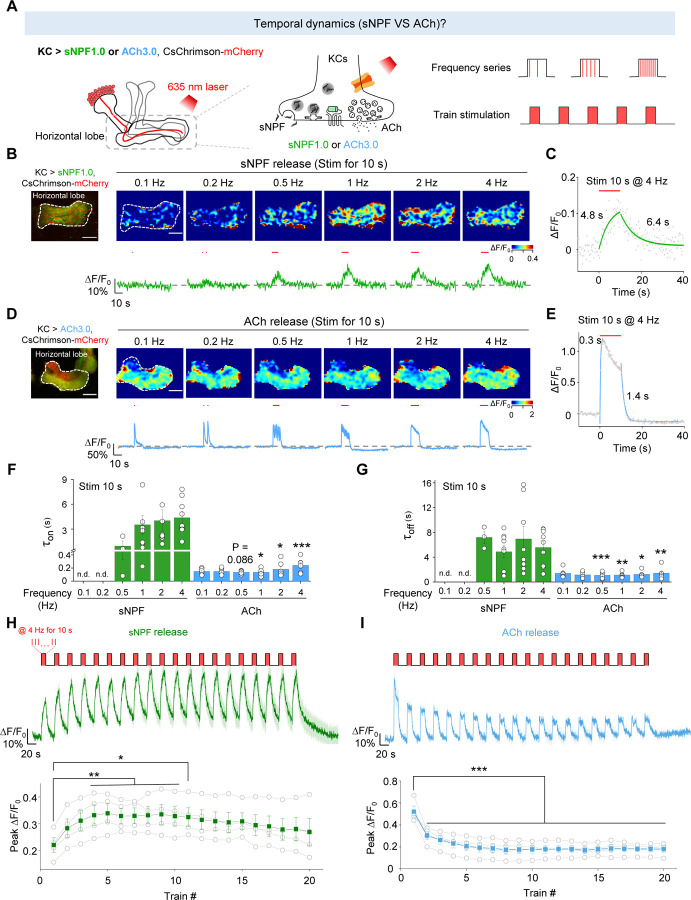
Fig. 4 |. The sNPF1.0 and ACh3.0 GRAB sensors reveal distinct activity-dependent properties for sNPF and ACh release.
(A) Schematic diagram depicting the strategy for measuring the temporal dynamics of sNPF or ACh release in the horizontal lobe using sNPF1.0 and ACh3.0, respectively. The 100 μM nAChR antagonist mecamylamine (Meca) was present throughout these experiments.
(B and D) Representative fluorescence image (top left), pseudocolor images (top right), and traces (bottom right) of the change in sNPF1.0 (B) and ACh3.0 (D) fluorescence in response to the indicated light stimuli (red bars). Scale bars, 25 μm.
(C and E) Example traces showing the change in sNPF1.0 (C) and ACh3.0 (E) fluorescence before, during, and after the indicated light stimuli; the rise and decay phases are each fitted with a single-exponential function.
(F and G) Summary of the rise (F) and decay (G) time constants (τon and τoff) measured for the change in sNPF1.0 and ACh3.0 fluorescence in response to the indicated light stimuli.
(H and I) Individual traces (top) and summary (bottom) of the change in sNPF1.0 (H) and ACh (I) fluorescence in response to the indicated light stimuli.
Data are shown as mean ± s.e.m. in B, D, H and I, with the error bars or shaded regions indicating the s.e.m. ***P < 0.001, **P < 0.01, and *P < 0.05.

