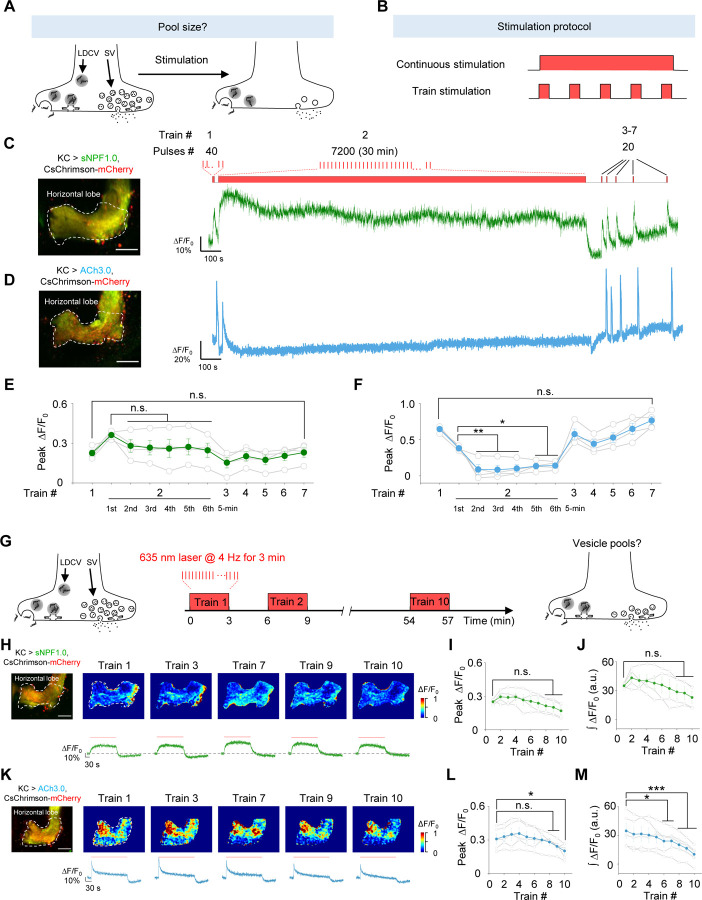
Fig. 5 |. The sNPF1.0 and ACh3.0 GRAB sensors reveal distinct pools of sNPF- and ACh-containing vesicles.
(A and B) Schematic diagram depicting the experimental strategy (A) and stimulation protocol (B) used to study the size of vesicle pools containing sNPF and ACh. The 100 μM nAChR antagonist mecamylamine (Meca) was present throughout these experiments.
(C and D) Representative fluorescence image (left) and traces (right) of the change in sNPF1.0 (C) and ACh3.0 (D) fluorescence in response to the indicated light stimuli. Scale bars, 25 μm.
(E and F) Summary of peak ΔF/F0 measured for sNPF1.0 (E) and ACh3.0 (F); n = 4 flies each.
(G) Schematic diagram depicting the strategy for studying vesicle pools containing sNPF and ACh.
(H and K) Representative fluorescence images (top left), pseudocolor images (top right), and traces (bottom right) of the change in sNPF1.0 (H) and ACh3.0 (K) fluorescence in response to the indicated trains of light; n = 4 flies. (I and J) Summary of the peak (I) and integrated (J) change in sNPF1.0 (H) fluorescence in response to the indicated trains of light; n = 4 flies. Scale bars, 25 μm.
(L and M) Summary of the peak (L) and integrated (M) change in ACh3.0 (K) fluorescence in response to the indicated trains of light; n = 4 flies.
Data are shown as mean ± s.e.m. ***P < 0.001, *P < 0.05, and n.s., not significant.

