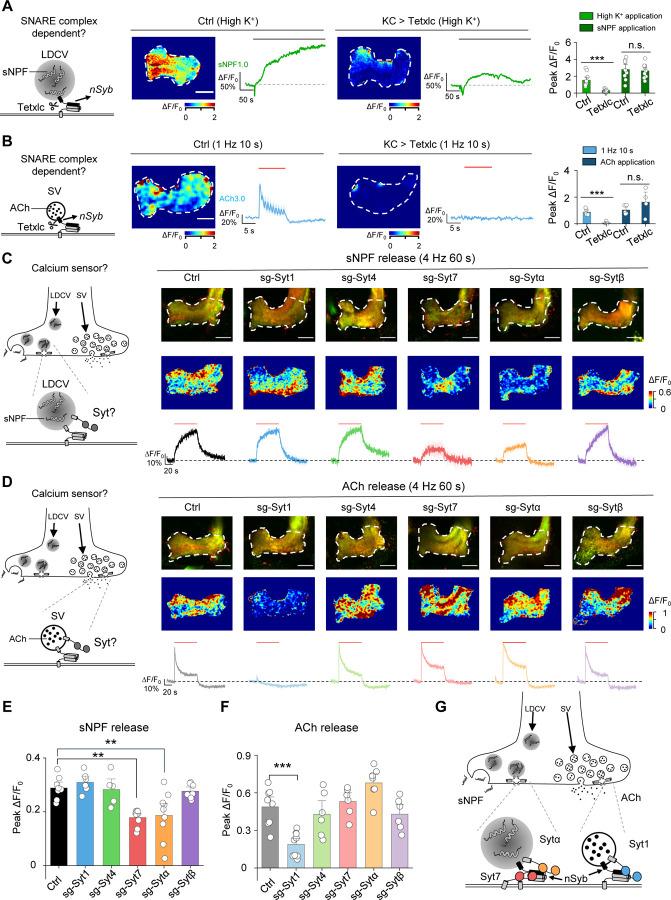
Fig. 6 |. The sNPF1.0 and ACh3.0 GRAB sensors reveal distinct differences in the molecular control of sNPF and ACh release.
(A) Left, schematic diagram depicting the release of sNPF via nSyb, a core component of the SNARE complex. Also shown are representative pseudocolor images and traces (middle) and the summary (right) of peak sNPF1.0 ΔF/F0 measured in response to high K+ and sNPF application in transgenic flies expressing sNPF1.0 alone (Ctrl) or sNPF1.0 together with the tetanus toxin light chain (Tetxlc) to cleave nSyb. The horizontal lobe is indicated (white dashed outline). Scale bar, 25 μm.
(B) Left, schematic diagram depicting the release of ACh via nSyb. Also shown are representative pseudocolor images and traces (middle) and the summary (right) of peak ACh3.0 ΔF/F0 in response to light stimuli and ACh application in transgenic flies expressing ACh3.0 alone (Ctrl) or ACh3.0 together with Tetxlc. Scale bar, 25 μm.
(C and D) Left, schematic diagrams depicting the release of sNPF (C) and ACh (D) via synaptotagmins (Syts). Also shown are representative fluorescence images (top right) and pseudocolor images (middle right), and traces (bottom right) of the change in sNPF1.0 (C) and ACh3.0 (D) fluorescence in response to 240 light pulses at 4 Hz in control flies (Ctrl) and in flies in which Syt1, Syt4, Syt7, Sytα, or Sytβ was knocked out using CRISPR/Cas9.
(E and F) Summary of the peak change in sNPF1.0 (E) and ACh3.0 (F) fluorescence measured in the indicated flies. Scale bars, 25 μm.
(G) Model depicting the shared and distinct proteins that mediate the release of sNPF and ACh in large dense-core vesicles (LDCVs) and synaptic vesicles (SVs), respectively.
Data are shown as mean ± s.e.m. in b, c and d, with the error bars or shaded regions indicating the s.e.m. ***P < 0.001, **P < 0.01, and n.s., not significant.

