
Figure 2. Microglia-containing cerebral organoids express microglial genes.
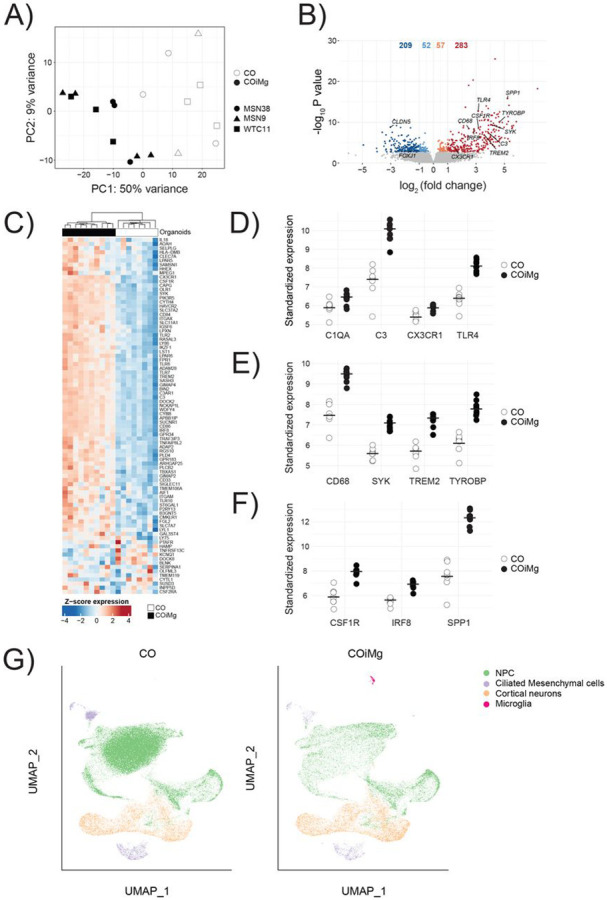
(A) Bulk RNAseq PCA Plot of the first two PCs displaying CO and COiMg sample distance in all three donor iPSC lines. N=8-9 per condition, and N=3 per line (white = CO, black = COiMg, circle = MSN38, triangle=MSN9, square = WTC11). PCs were calculated based on the top 500 variable genes.
(B) Volcano plot showing differentially expressed genes. Microglial genes were annotated. Each dot represents a gene. Colorization shows genes differentially expressed at fold change < 0.1 (lightblue = downregulated at log2FC < 0, orange = upregulated at log2FC > 0, darkred = upregulated at log2FC > 1, darkblue = downregulated at log2FC < −1).
(C) Heatmap of row-scaled vst-standardized and corrected gene expression of microglia genes in CO and COiMg.
(D,E,F) Dotplots of vst-standardized and corrected expression of specific microglial markers: C1QA, C3, CX3CR1, TLR4, CD68, SYK, TREM2, TYROBP, CSF1R, IRF8 and SPP1. Each dot represents one organoid.
(G) UMAP of CO and COiMg showing cluster identity for NPC, Ciliated Mesenchymal cells, Cortical Neurons and Microglia. Each dot is a single cell.