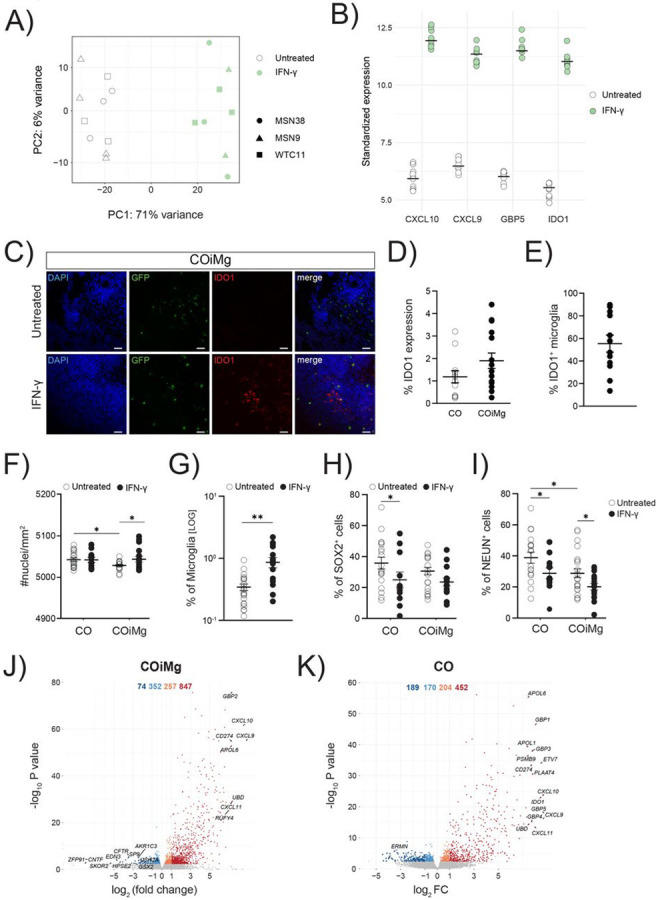
Figure 6. IFN-γ-mediated signaling pathways are upregulated in both CO and COiMg.

(A) PCA plot of the first two PCs displaying COiMg sample distances in untreated and stimulated conditions (white = untreated, green = IFN-γ) from bulk RNAseq. N= 3 per stimulants per iPSC line. PCs were calculated based on the top 500 variable genes.
(B) Dotplots of vst-standardized and corrected bulk RNAseq expression of the differentially upregulated genes of CXCL10, CXCL9, GBP5 and IDO1 in IFN-γ-treated COiMg.
(C) Representative image of COiMg untreated (upper) or treated with IFN-γ (lower) stained with IDO1. Microglia are labelled with GFP. HOECHST was used for nuclei staining. 20X Magnification. Scale bar, 50 μm.
(D) Percentage of IDO1 expression in CO and COiMg. Data are represented as points and error bars as mean ± SEM. N= 2 biological replicates (batches) per line. All three lines pulled.
(E) Percentage of IDO1+ microglia was calculated in COiMg. Data are represented as points and error bars as mean ± SEM. N= 2 biological replicates (batches) per line. All three lines pulled.
(F) Quantification of number of nuclei per mm2 was performed in untreated and IFN-γ-treated CO and COiMg. Data are represented as points and error bars as mean ± SEM. N= 3 biological replicates (batches) per line. Two-way ANOVA test was performed. * P ≤ 0.05.
(G) Percentage of microglia, expressed on a logarithmic scale, was calculated in untreated and IFN-γ-treated COiMg. Data are shown as points with mean ± SEM. N= 2 biological replicates (batches) per line. All three lines pulled. Mann Whitney t-test was performed. ** P ≤ 0.01.
(H,I) Percentage of SOX2+ (H) and NeuN+ (I) cells was calculated in untreated and IFN-γ-treated CO and COiMg. Data are represented as points and error bars as mean ± SEM. N= 3 biological replicates (batches) per line; all donor lines are pulled. Two-way ANOVA test, followed by Fisher’s LSD post-hoc test, was performed. * P ≤ 0.05.
(J,K) Volcano plots showing differentially expressed genes in IFN-γ-treated COiMg (J) and CO (K). Each dot represents a gene. Colorization shows genes differentially expressed at fold change < 0.1 (lightblue = downregulated at log2FC < 0, orange = upregulated at log2FC > 0, darkred = upregulated at log2FC > 1, darkblue = downregulated at log2FC < −1).
