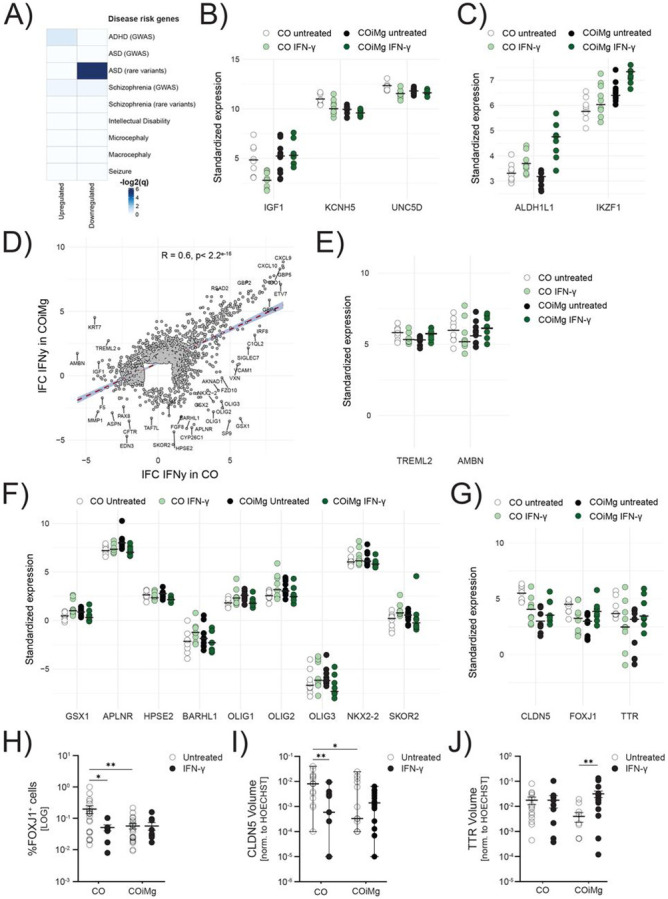
Figure 7. Transcriptional and proteomic changes between CO and COiMg when treated with IFN-γ.

(A) Heatmap displaying the −log2(q-values) from GSEA testing overlap between IFN-γ-related DEGs and SFARI databases for psychiatric disorders. Higher −log2(q-values) is equivalent to higher significance of overlap.
(B,C) Dotplot of vst-standardized and corrected bulk RNAseq expression values of SFARI ASD rare variants that were also differentially expressed under IFN-γ stimulation in CO and COiMg.
(D) Scatter plot displaying the Pearson’s r correlation of log-fold changes (filtered for lFC > 1 and lFC < −1) between CO and COiMg treated with IFN-γ. Each dot represents one gene.
(E,F) Dotplots of vst-standardized and corrected bulk RNAseq gene expression of selected DEGs between CO and COiMg, when treated with IFN-γ.
(G) Dotplots of vst-standardized and corrected bulk RNAseq gene expression of FOXJ1, CLDN5 and TTR between CO and COiMg, when treated with IFN-γ.
(H) Percentage of FOXJ1+ cells was quantified in CO and COiMg. Data are represented as points and error bars as mean ± SEM. N= 2 biological replicates (batches) per line. All three lines pulled. Two-way ANOVA test, followed by Fisher’s LSD post-hoc test, was performed. * P ≤ 0.05, ** P ≤ 0.01.
(I) Quantification of CLDN5 surface volume, normalized to HOECHST volume, was performed in CO and COiMg. Data, expressed on a logarithmic scale, are represented as points and error bars as mean ± SEM. N= 2 biological replicates (batches) per line. All three lines pulled. Two-way ANOVA test, followed by Fisher’s LSD post-hoc test, was performed. * P ≤ 0.05, ** P ≤ 0.01.
(J) Quantification of TTR surface volume, normalized to HOECHST volume, was performed in CO and COiMg. Data, expressed on a logarithmic scale, are represented as points and error bars as mean ± SEM. N= 2 biological replicates (batches) per line. All three lines pulled. Two-way ANOVA test, followed by Fisher’s LSD post-hoc test, was performed. ** P ≤ 0.01.
