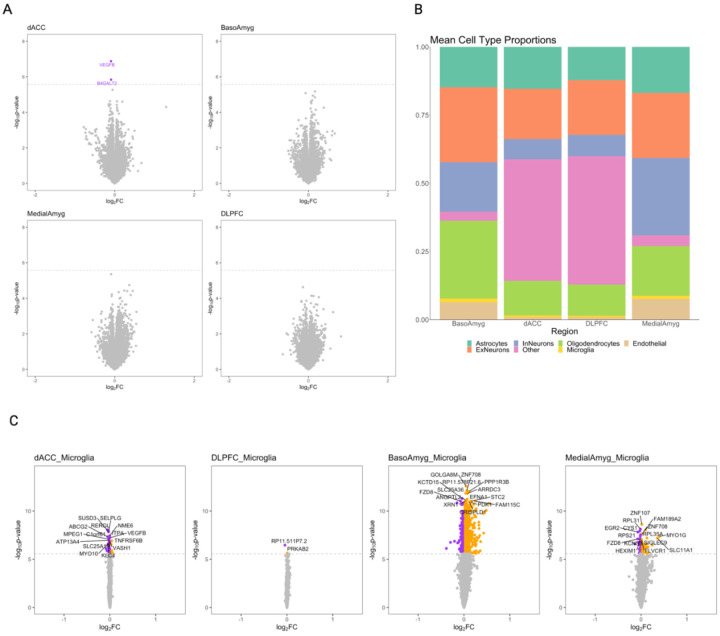
Figure 1: Chronic pain DEGs are found in the dACC and in microglia of the basolateral amygdala in bulk and cell-type-level analyses.
1A: Bulk tissue chronic pain DEGs. Purple: significantly (PBonferroni < 0.05) downregulated, dotted line = DEG regression p value significance threshold for that bulk region. FC = fold change. 1B: Imputed cell type proportions vary across bulk regions – note neurons only present in reference data for cortex (Psychencode) and oligodendrocyte progenitor cells (OPCs) only present in amygdala reference data (Yu et al), OPCs and Neurons both marked ‘Other’ in this figure panel. FC = fold change. 1C: Chronic pain cell type DEGs in microglia per region. Purple = significantly (PBonferroni < 0.05) downregulated, orange = significantly (PBonferroni < 0.05) upregulated, dotted line = p value significance threshold. For legibility only the top 15 DEGs are labeled in cell type results panel. FC = fold change. InN = inhibitory neuron, ExN = excitatory neuron.

