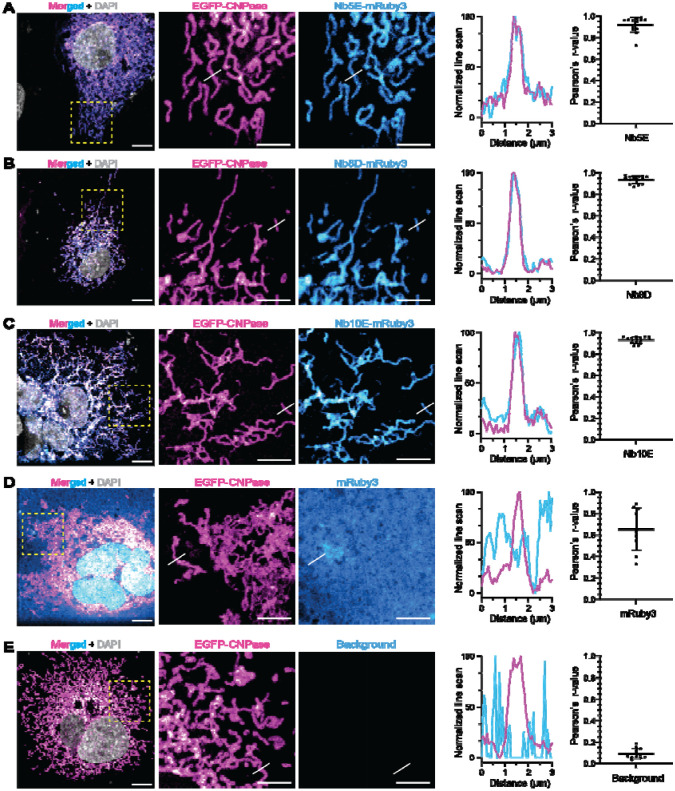
Figure 8. Nanobodies as intrabodies in COS-7 cells.
Confocal images were acquired after COS-7 cells were co-transfected with TOM70-EGFP-CNPase and an intrabody fused to mRuby3. (a) Merged signals in a wide field of view, followed by zoomed regions (yellow square) displaying the mitochondria structures by TOM70-EGFP-CNPase (magenta) and the signal from mRuby3 fused to iNbCNP 5E. White lines denote the position where the line-intensity profile (line-profile) is shown in the graph. Pearson’s correlation between the mitochondrial EGFP signal (magenta) and the mRuby3 signal from the intrabody (cyan) was calculated from 9 independent cells. The graph represents the mean ± standard deviation. The same analysis was performed for iNbCNP 8D (B), iNbCNP 10E (C), and the controls with cytosolic mRuby3 not fused to any intrabody (D), or no intrabody transfected (E). This last control rules out potential signal bleed-through from EGFP into the mRuby3 channel.

