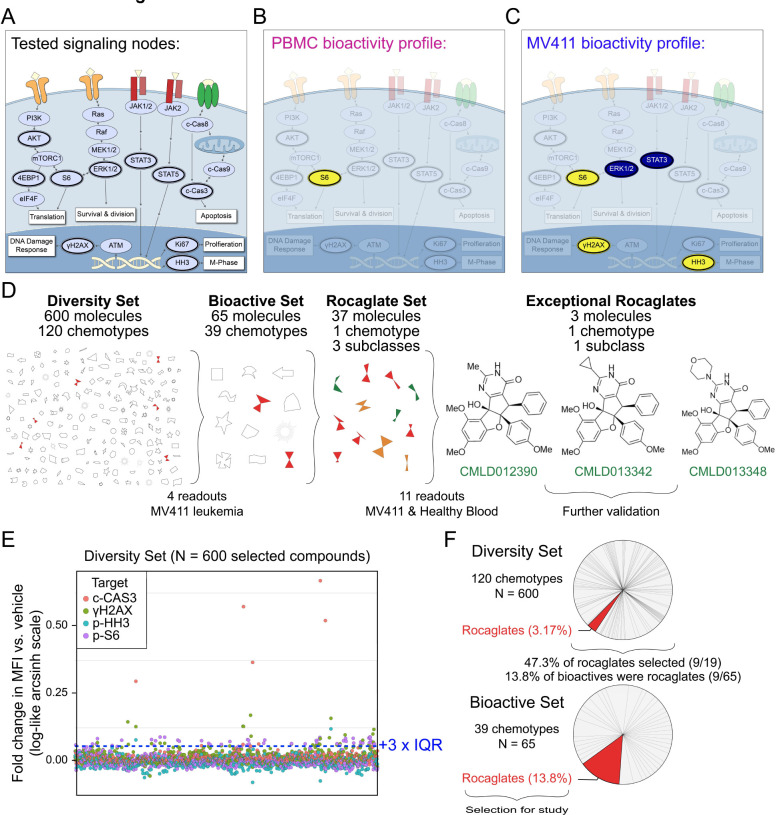
Figure 1 – Rocaglates displayed exceptional activity in a multiplexed single cell bioactivity assay.
A) A model of a cell annotated with the key readouts measured (dark outlines). mTOR pathway activation is explored through testing p-AKT, p-ERK1/2, p-S6, and p-4EBP1, which regulate translation, among other cellular processes. Activation of the DNA damage response is explored through γH2AX. Ki67 and p-HH3 are indicative of proliferation and M-phase of the cell cycle, respectively. p-STAT3 and p-STAT5 are transcription factors that regulate the expression of cell cycle, survival, and pro-inflammatory genes. Activation of apoptosis is measured through the detection of c-CAS3. Key readouts activated (yellow) or inhibited (blue) by the exceptional three rocaglates (shown in D) are depicted for PBMC in B) and MV411 in C). D) Depiction of the progression from 600 compound Diversity Set to three exceptional rocaglates. A symbolic representation of the 600-compound Diversity Set comprised of 120 chemotypes, the 65 molecules identified as bioactive, and the Rocaglate Set selected for structure-bioactivity relationship studies. The names and structures for the three exceptional rocaglates are shown. The number of total molecules, chemotypes, and subclasses, where relevant, are depicted above each respective phase of testing. The number of readouts and cells used for testing are depicted below each phase. E) The arcsinh scaled fold change in median fluorescence intensity vs. vehicle for the 600-compound Diversity Set of natural products on the four readouts tested. Each readout is represented by a different colored circle. The bioactivity threshold was drawn at the vehicle median + 3 x interquartile range (IQR) (0.0573). F) The percentage of the 600 compounds from each of the 120 chemotypes represented in the Diversity Set. The pie slice corresponding to rocaglates is highlighted in red. Bioactive molecules were selected based on the threshold shown in E). The percentage of the 65 bioactive molecules from each of the 39 chemotypes represented is shown, with the pie slice corresponding to rocaglates highlighted in red.

