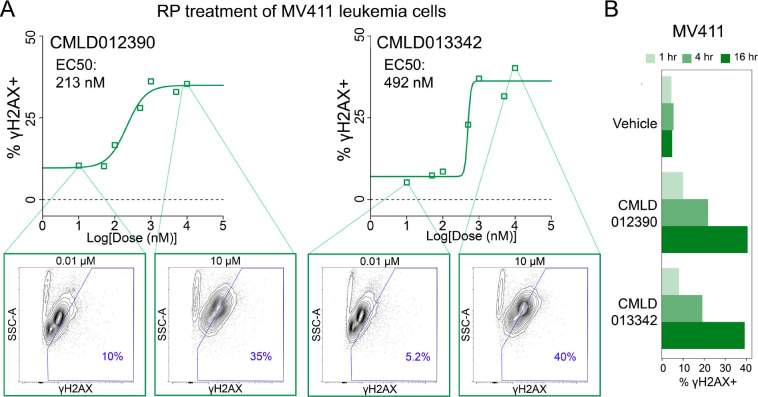
Figure 7 – The top 2 RPs activated γH2AX with < 500nM potency within 4 hours.
A) Dose-response titration curves depicting % γH2AX+ cells (based on expert gating) vs. log[dose(nM)]. A half-maximal activating concentration (EC50) curve was fitted to the data and γH2AX EC50 values are shown in the top left of each plot. Contour plots of Side Scatter Area (SSC-A) vs. γH2AX at 10 μM and 0.01 μM, respectively, with 10% of cells per contour are shown for each compound. A polygon gate is drawn in blue to delineate γH2AX+ cells, with the % γH2AX+ cells within the gate depicted in the lower right corner. B) Bar plots depicting % γH2AX+ cells derived from a time course experiment at 1, 4, and 16hr for Vehicle, CMLD012390, and CMLD013342.

