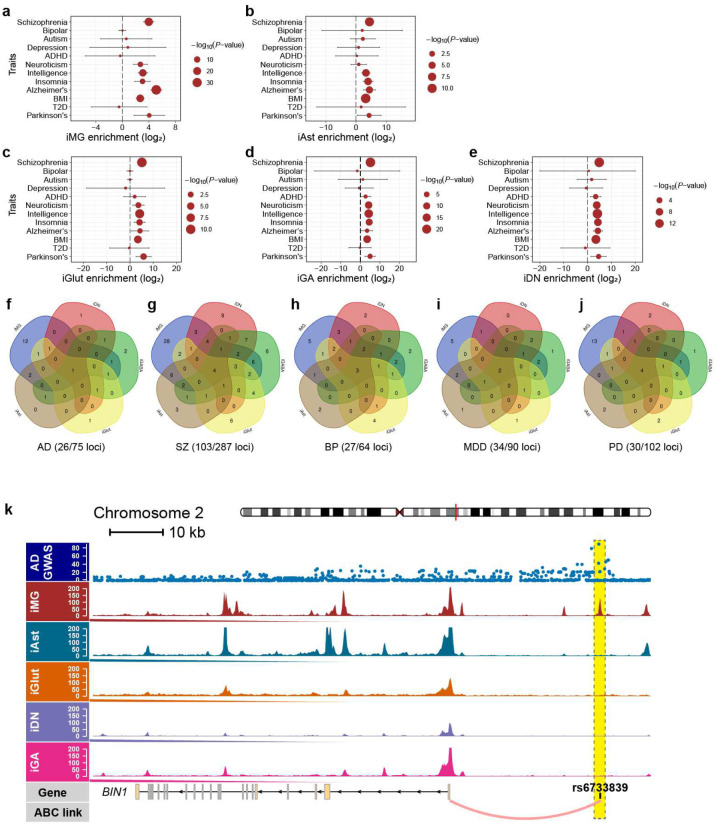
Extended Data Fig. 2.
Enrichment of ASoC SNPs for GWAS risk variants LOAD and major NPD in different cell types. (a) to (e) Dot plots showing the fold of GWAS enrichment (log2) and P-value (-log10) of each disorder or trait across different cell types. The analysis was done by using Torus (see Method). (f) to (j) Number of GWAS risk loci with at least one of the GWAS index risk SNPs or their proxies showing ASoC in different cell types for LOAD, SZ, BP (bipolar), MDD (major depressive disorder), and PD. Note the LOAD GWAS risk loci with functional LOAD risk SNPs that show ASoCs are predominately found in iMG (19/26 loci). (k) The GWAS risk SNP rs6733839 at the BIN1 locus is an ASoC SNP within an iMG-specific OCR peak located in an enhancer assigned to target gene BIN1 by ABC analysis.

