
Fig. 2.
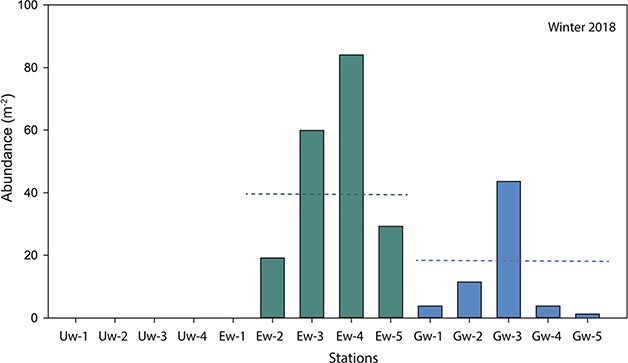
Abundance of Boreomysis arctica sampled during winter 2018 in the lower estuary (Ew) and the Gulf (Gw) of St. Lawrence. Data for 2017 were not included due to malfunctioning of the flowmeter. Dashed line represents the mean of each region.
Official websites use .gov
A
.gov website belongs to an official
government organization in the United States.
Secure .gov websites use HTTPS
A lock (
) or https:// means you've safely
connected to the .gov website. Share sensitive
information only on official, secure websites.
Abundance of Boreomysis arctica sampled during winter 2018 in the lower estuary (Ew) and the Gulf (Gw) of St. Lawrence. Data for 2017 were not included due to malfunctioning of the flowmeter. Dashed line represents the mean of each region.