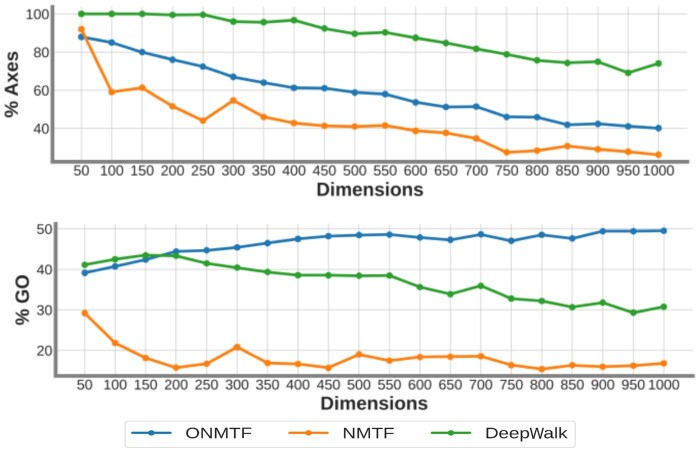
Figure 1.
The axes of the human ONMTF, NMTF, and DeepWalk embedding spaces uncover the cell’s functional organization from the human PPI network. The top panel shows the percentage of axes that capture at least one embedded GO BP term. The bottom panel shows the percentage of the total embedded GO BP terms that are captured by the axes of the space. For each panel, the horizontal axis displays the number of dimensions of the embedding space. For each panel, the color of the lines corresponds to the three tested embedding algorithms: ONMTF (blue), NMTF (orange), and DeepWalk (green).

