Figure 1. .
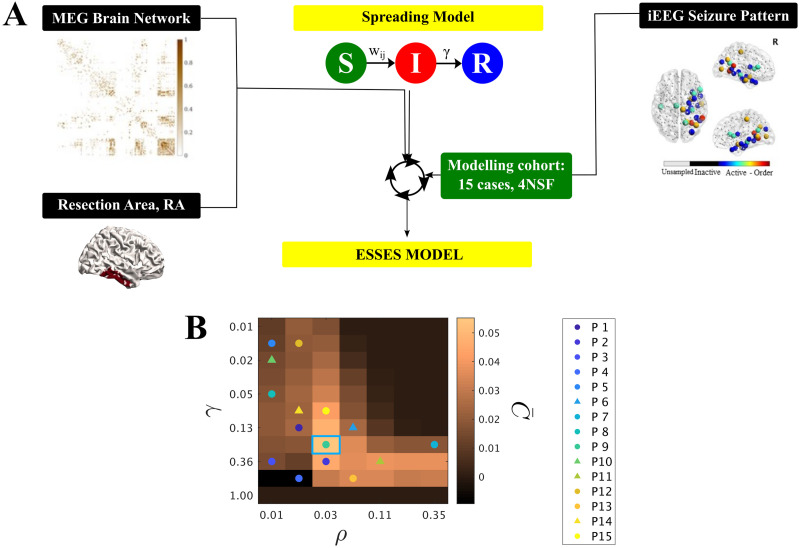
(A) Sketch of ESSES’s parameter-fitting scheme. The parameters controlling seizure propagation, namely the density of links in the network ρ and the global recovery probability γ, were set so as to maximize the similarity between ESSES-modeled seizures and iEEG-recorded ones for the modeling cohort (Equation 1). Seizures were simulated via SIR dynamics over MEG patient-specific brain networks, and setting the resection area as the seed of epidemic spreading. (B) (ρ, γ) map displaying the average model fit (modeling cohort). The data points indicate the parameters corresponding to the best individual fit for each patient, with circles (triangles) indicating SF (NSF) cases (corresponding C values can be seen in Supporting Information Figure S2). Most individual best fits (data-points) fall within the same region (SIR phase transition) but there is large variability (in fact, we found low signal to noise ratios of approx. 1/2; see Supporting Information Figure S3A). The blue square marks the maximum of the goodness of fit, and the corresponding (ρ, γ) values were used for the subsequent analyses. The y-axis is shown using a logarithmic scale.

