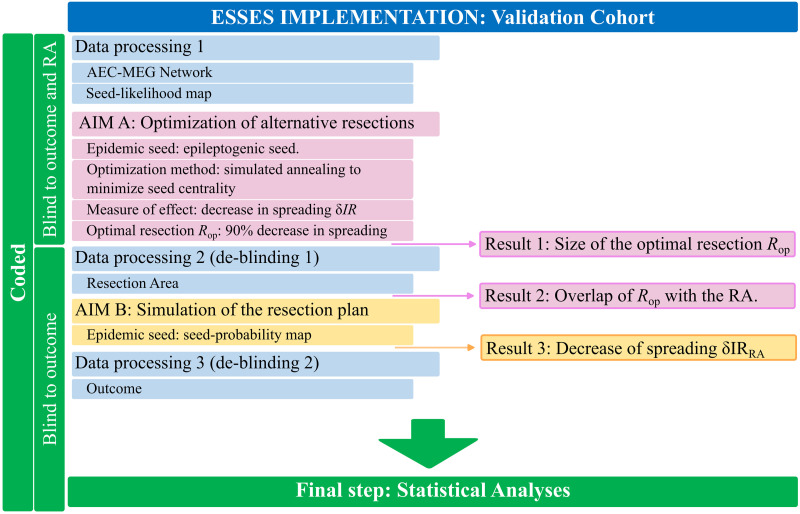
Figure 2. .
Processing and analysis pipeline. The patient data were processed in three different steps (blue boxes) for the validation cohort. Firstly, ESSES’s key ingredients, the patient-specific MEG brain network and the seed likelihood map, were processed. The research team remained blind to the resection area and outcome of each patient. The first analysis (AIM A: Optimization of alternative resections, pink boxes) then took place and the first result (Result 1: Size of the optimal resection Rop) was obtained. Then, the patients’s resection areas were processed (de-blinding step 1) and the second result was obtained (Result 2: Overlap of Rop with the resection area, RA). AIM B (Simulation of the resection plan, yellow boxes) could then take place: the simulation of the resection plan, by performing a virtual resection of the resection area. The third and final result (Result 3: Decrease of spreading δIR(RA)) was then obtained. Then, the second and final de-blinding took place to recover the outcome of each patient and perform the statistical analyses.

