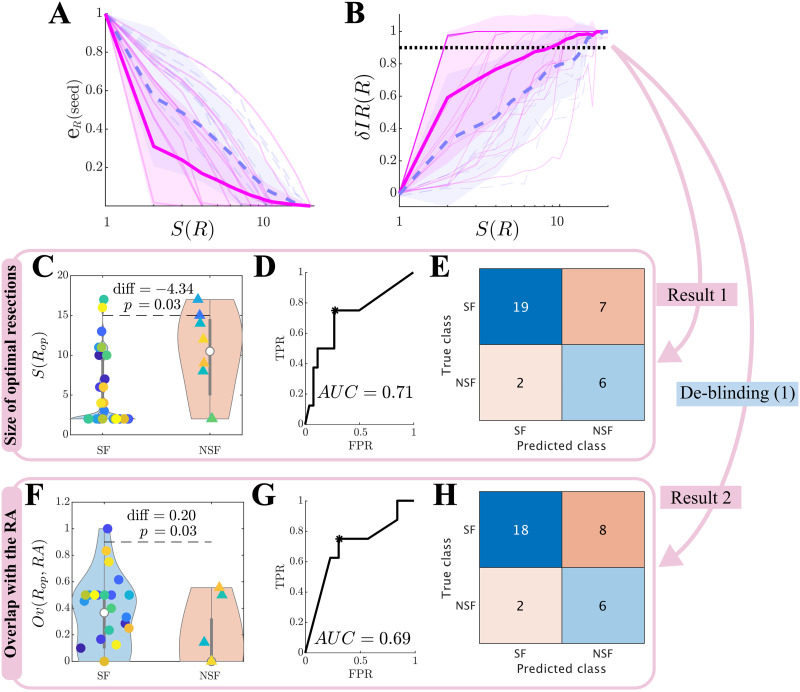
Figure 4. .
Optimal (alternative) resection strategies (validation cohort). Effect of optimal virtual resections of size S(R) as measured by (A) the normalized seed efficiency eR(seed), and (B) normalized decrease in seizure propagation δIR(R). Blue dashed lines stand for NSF patients, and pink solid lines for SF patients. Thin lines show individual patients, and darker wide lines the group averages, with shaded areas indicating the standard deviations. The apparent darker pink line at the top of the plot arises from overlap of several individual lines. (C–H) Group level comparison of the size of optimal resections S(Rop) (C–E) and their overlap with the resection area Ov(Rop, RA) (F–H). Panels C and F show the distribution of values of each patient group, with significance results obtained with exact two-sided Wilcoxon ranksum tests. Panels D and G show the corresponding ROC classification analyses, where TPR and FPR stand respectively for the true positive (NSF cases classified as NSF) and false positive (SF cases classified as NSF) rates. Finally, panels E and H show the confusion matrices corresponding to the optimal point (Youden criterion, black asterisks in the middle panels) of the ROC curves.

