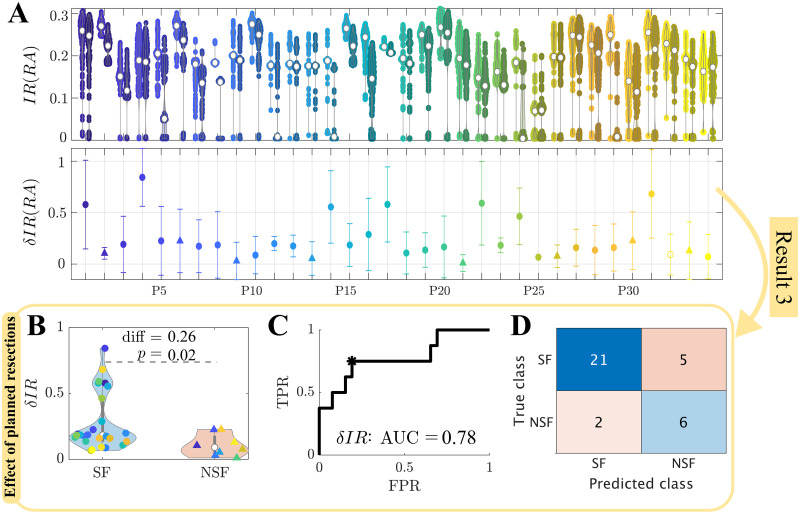
Figure 5. .
Simulation of the planned resection strategy (validation cohort). (A) The top panel shows seizure propagation IR before (left point cloud for each patient) and after (right point clouds) the resection, for 300 iterations of the seed regions, for each patient. The bottom panel shows the average relative decrease in seizure propagation δIR(RA), with error bars given by the standard deviation over seed iterations. (B) Comparison of the relative decrease in seizure propagation δIR(RA) between the SF and NSF groups. Each point corresponds to one patient. (C) ROC curve of the group classification based on δIR(RA). TPR and FPR indicate, respectively, the true positive (NSF cases classified as NSF) and false positive (SF cases classified as NSF) rates. (D) Classification results for the optimal point (black asterisk in panel C) of the ROC curve according to the Youden criterion.

