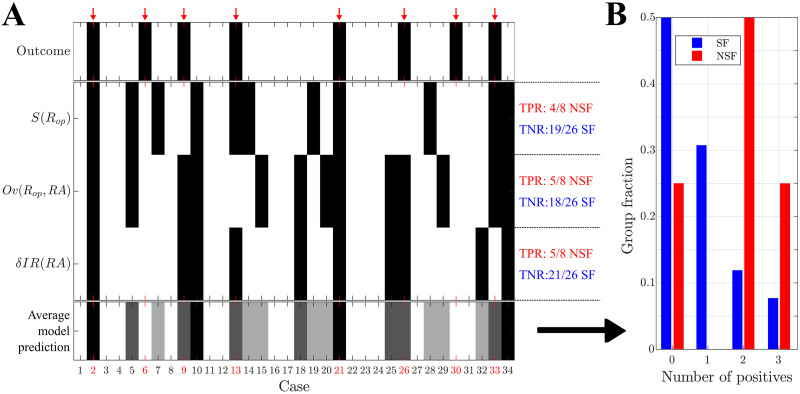
Figure 6. .
Prediction of surgical outcome: validation cohort. (A) Prediction results using each of the three model-based biomarkers of surgical outcome: the size of optimal resections S(Rop), the overlap between optimal resections and the resection area, Ov(Rop, RA), and the decrease in seizure propagation due to simulation of the planned resection strategy, δIR(RA). NSF (SF) cases are shown by black (white) rectangles. The bottom row shows the fraction of biomarkers (0–3 out of 3) with a positive (i.e., NSF) classification (refereed to as “Average model prediction” in the figure), for each patient. Surgical outcome is shown in the top row. NSF cases are highlighted by a red arrow and by red labels. (B) Relative number of cases identified as NSF by n biomarkers, n = 0, 1, 2, 3, respectively, for the SF (blue, left-side bars, N = 26) and NSF (red, right-side bars, N = 8) groups.

