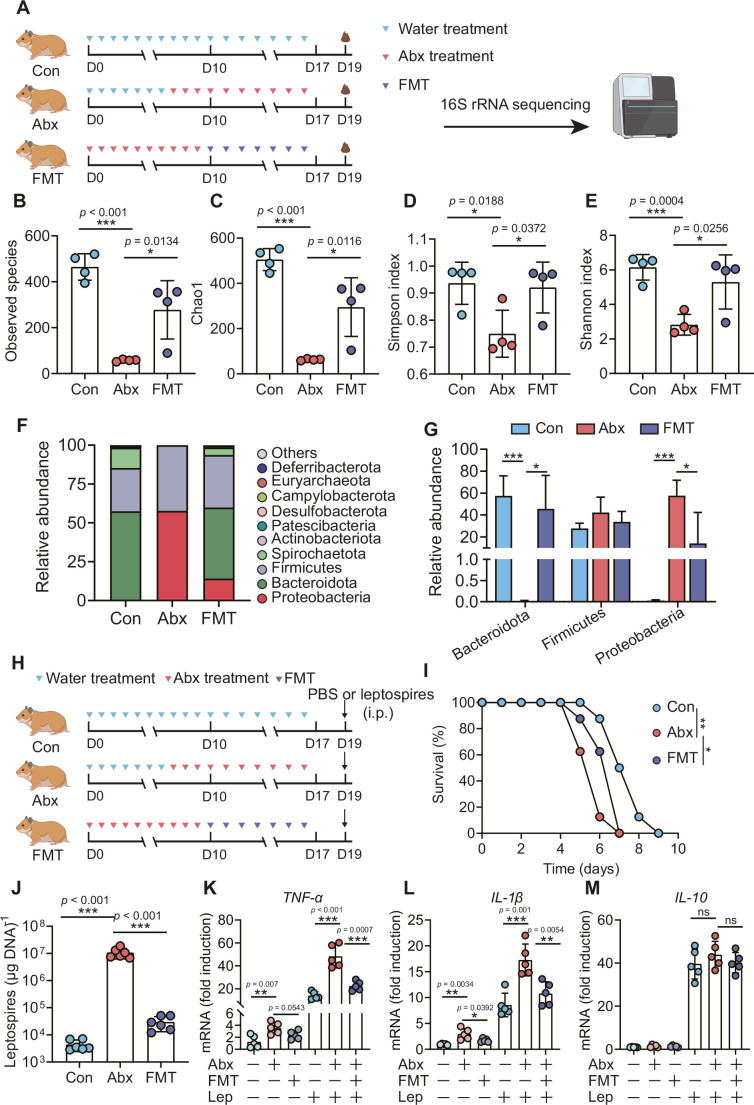
Figure 5. Microbiota depletion exacerbated leptospirosis.
(A) Flow diagram of the experiment. Hamsters were administered with Abx or water intragastrically once daily for 10 consecutive days. Then, fecal pellets were collected aseptically for 16S rRNA gene sequencing. (B, C) Observed species (B) and Chao1 (C) in the feces of hamsters. Observed species and Chao1 indicate species richness. (D, E) Simpson index (D) and Shannon index (E) in the feces of hamsters. Simpson and Shannon indexes indicate species diversity. (F) Relative abundance of the top 10 phyla in the feces of hamsters. (G) The relative abundance of Bacteroidetes, Firmicutes, and Proteobacteria in the Con, Abx, and fecal microbiota transplantation (FMT) groups. n = 4 per group. (H) Hamsters were treated with Abx as described above. After a 2-day washout period, hamsters were intraperitoneally infected with 106 L. interrogans. Then, the survival rate of the hamsters was recorded. n = 6 per group. (J) Leptospiral load in the blood of the Con, Abx, and FMT groups. n = 6 per group. (K, M) Gene expression of TNF-α (K), IL-1β (L), and IL-10 (M) in the blood of the three groups. n = 5 per group. Each infection experiment was repeated three times. Data are shown as the mean ± SEM and analyzed by using the Wilcoxon rank-sum test. Survival differences between the study groups were compared by using the Kaplan–Meier log-rank test. *p<0.05, **p<0.01, ***P<0.001. ns, not significant.


