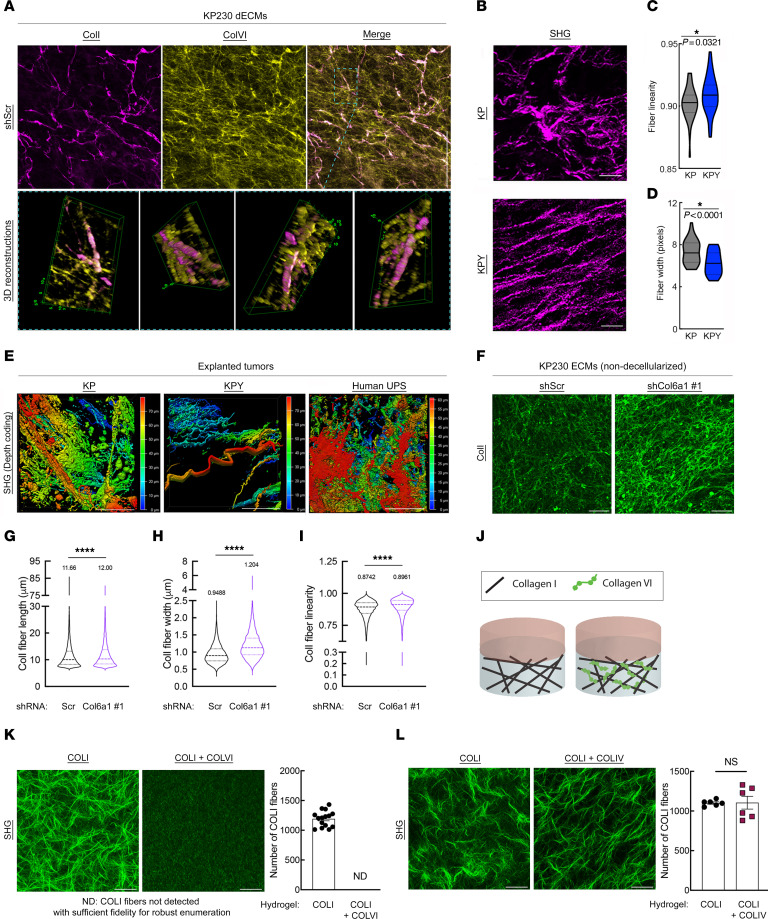
Figure 4. ColVI interacts with and remodels ColI in the UPS TME.
(A) Representative confocal micrographs (maximum-intensity Z-projections) and 3D reconstructions showing ColI and ColVI coimmunofluorescence in KP cell–derived dECMs. Scale bar: 100 μm. (B) Representative multiphoton second-harmonic generation (SHG) images (maximum-intensity Z-projections) of KP and KPY tumor sections. Scale bars: 50 μm. (C and D) Violin plots of CT-FIRE analysis of images from B. Mean fiber width and linearity were plotted for at least 5 separate fields (n = 5 mice per genotype); 2-tailed unpaired t test. (E) Representative depth-coded SHG images of human UPS, KP, and KPY explanted live tumors. Red, SHG signal farthest from the objective/greatest relative tissue depth; blue, SHG signal closest to the objective/shallowest relative tissue depth. Scale bars: 50 μm. (F) Representative confocal micrographs (maximum-intensity Z-projections) of extracellular ColI immunofluorescence in ECMs (non-decellularized) generated from control and shCol6a1 KP cells. Scale bars: 50 μm. (G–I) Violin plots depicting CT-FIRE analysis of images in F. Fiber length (G), width (H), and linearity (I) were plotted from 7 independent fields across multiple dECMs per condition. Numbers above violin plots indicate means. Thick and thin dotted lines within the shapes denote medians and quartiles 1 and 3, respectively. (J) Schematic of in vitro hydrogel system to assess how purified COLVI impacts purified COLI structure/organization. (K) Representative SHG images (maximum-intensity Z-projections with ×2 optical zoom) and quantification of COLI fiber number in COLI-alone and COLI plus COLVI hydrogels. Scale bars: 50 μm. (L) Representative SHG images (maximum-intensity Z-projections with ×2 optical zoom) and quantification of COLI fiber number in COLI-alone and COLI plus COLIV hydrogels. Scale bars: 50 μm. For K and L, quantification was performed for at least 6 independent fields across multiple hydrogels per condition. Brightness and contrast of all micrographs in Figure 4 were adjusted for publication.

